📝 24 Nov 2024
Last article we spoke about the (Twice) Daily Builds for Apache NuttX RTOS…
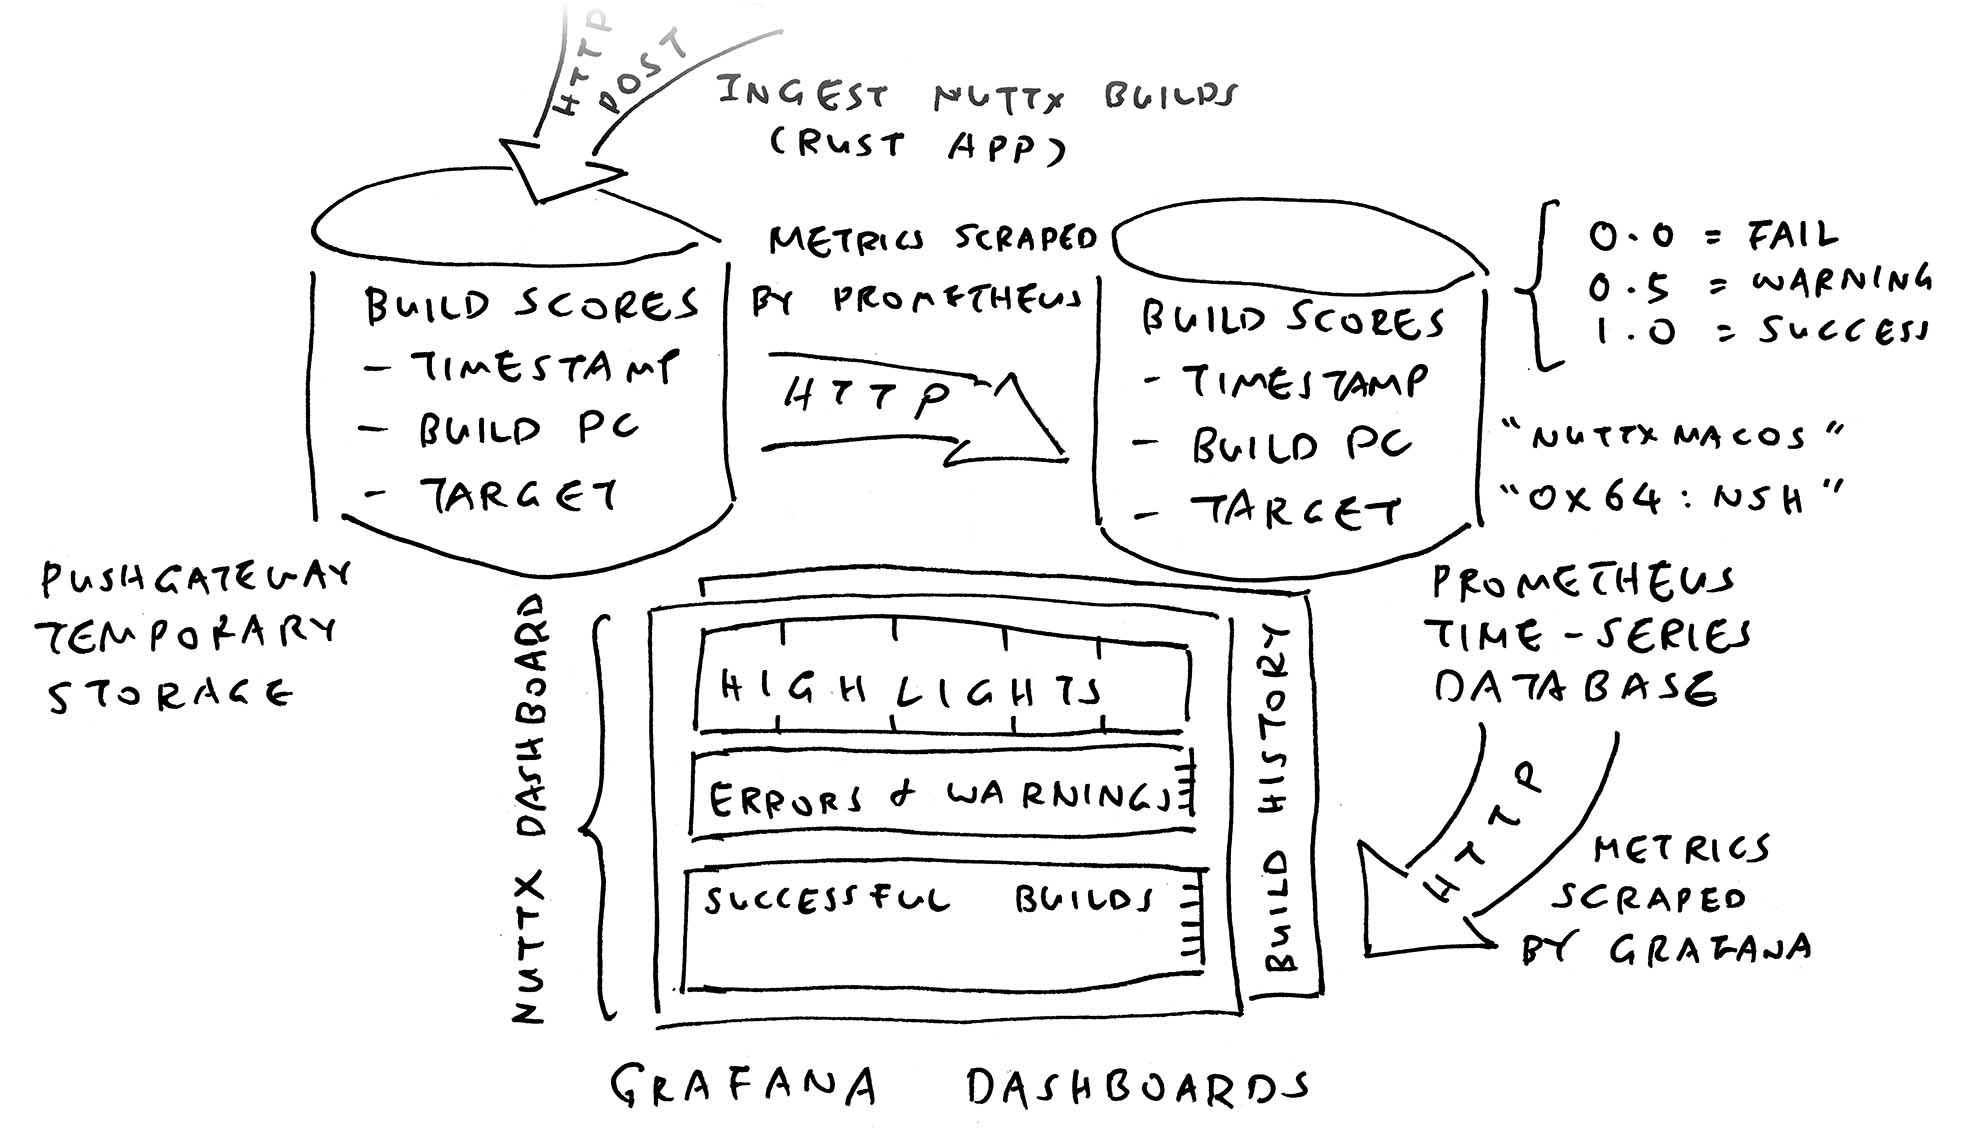
Today we talk about Monitoring the Daily Builds (also the NuttX Build Farm) with our new NuttX Dashboard…
-
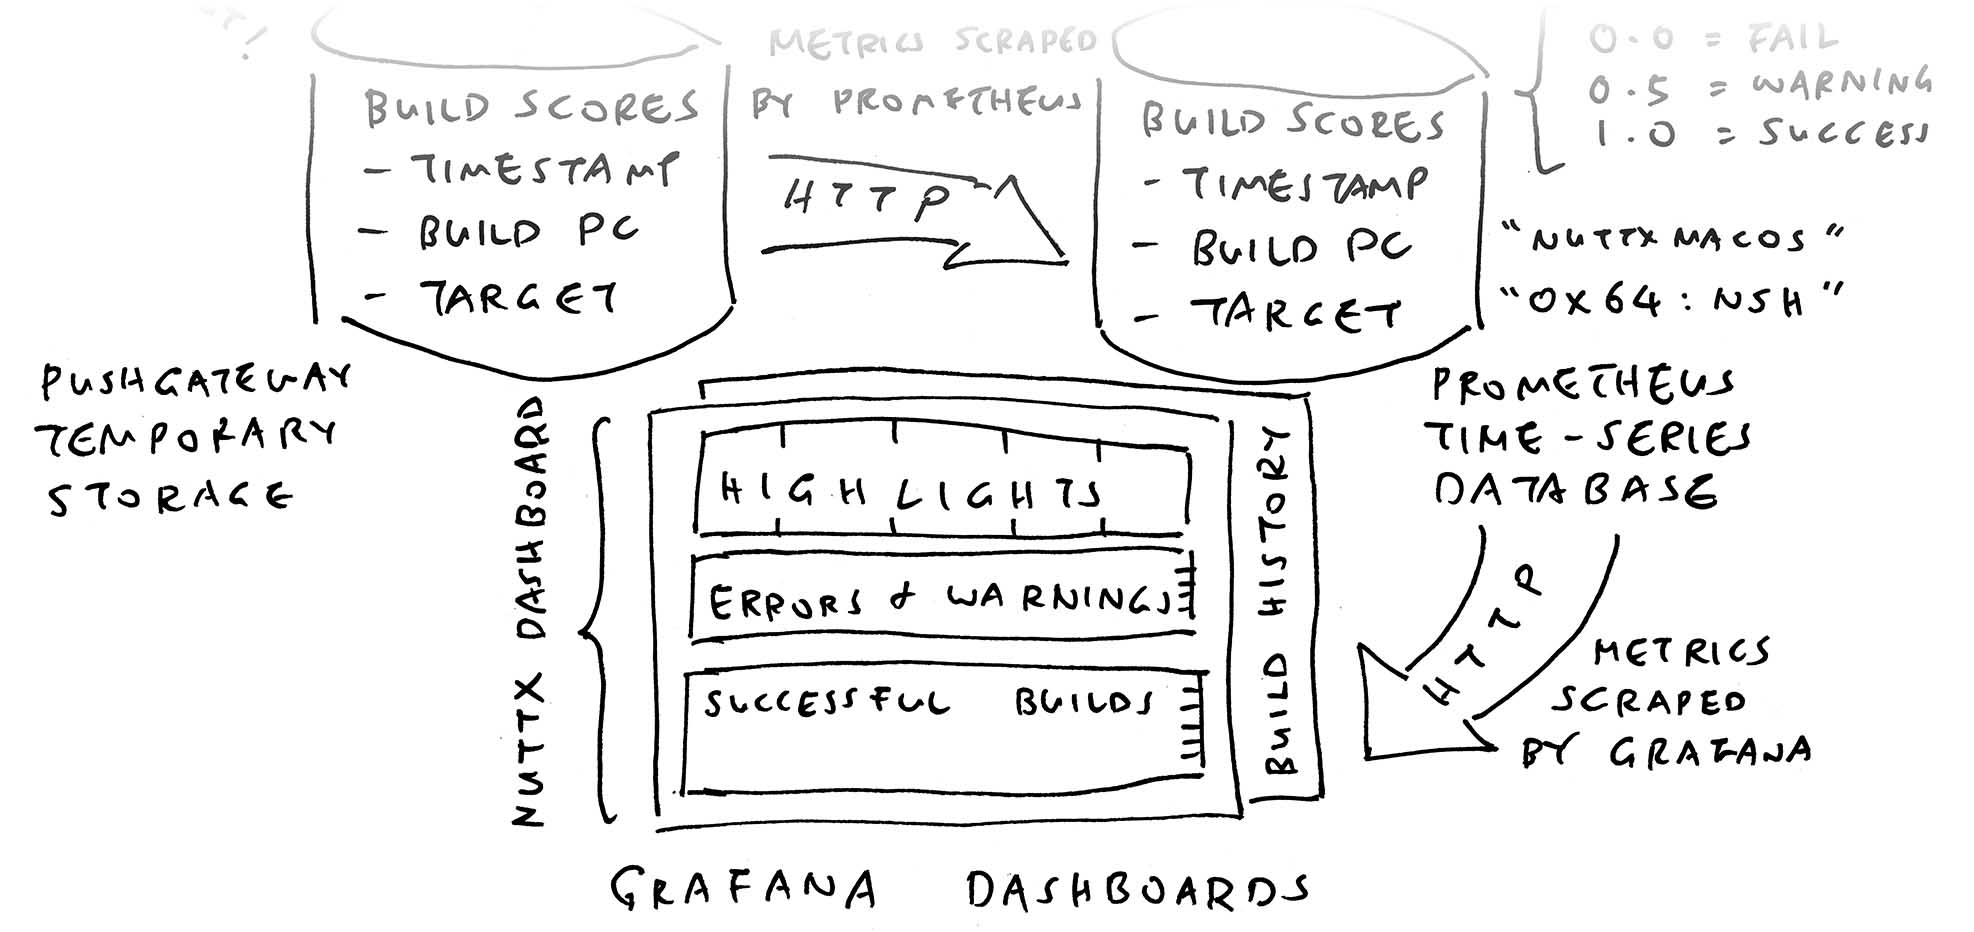
We created our Dashboard with Grafana (open-source)
-
Pulling the Build Data from Prometheus (also open-source)
-
Which is populated by Pushgateway (staging database)
-
Integrated with our Build Farm and GitHub Actions
-
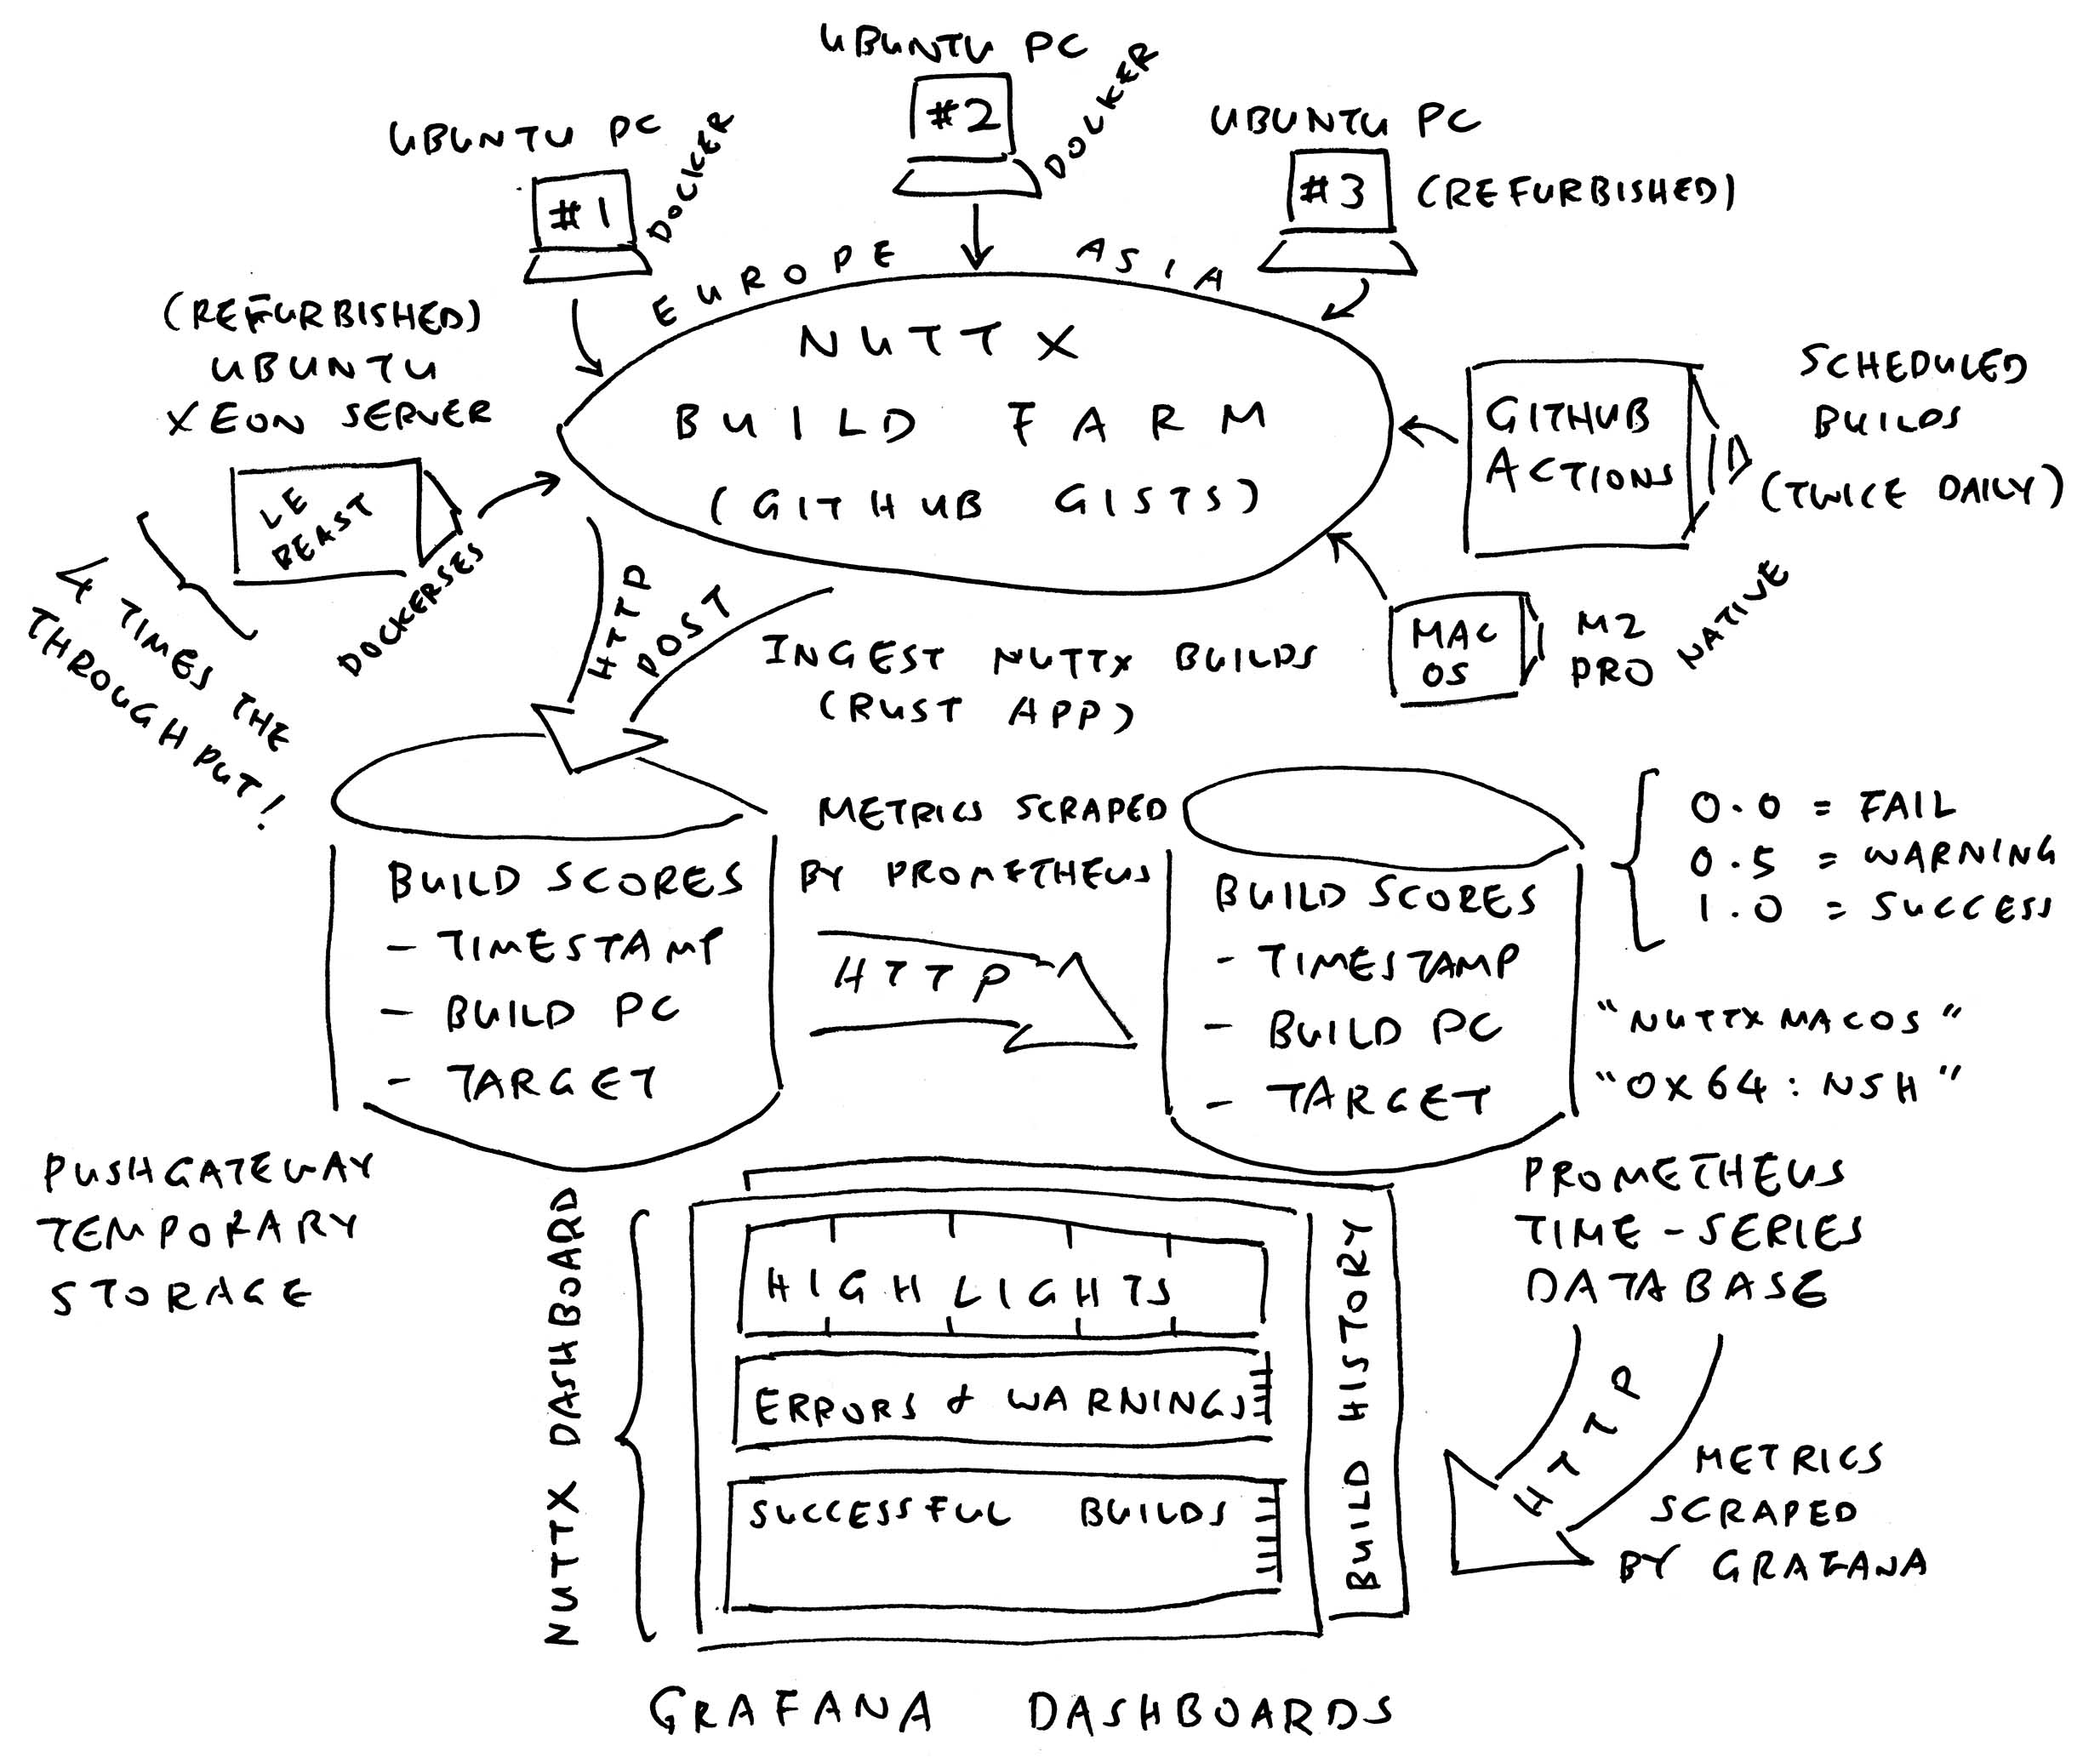
Why do all this? Because we can’t afford to run Complete CI Checks on Every Pull Request!
-
We expect some breakage, and NuttX Dashboard will help with the fixing
What will NuttX Dashboard tell us?
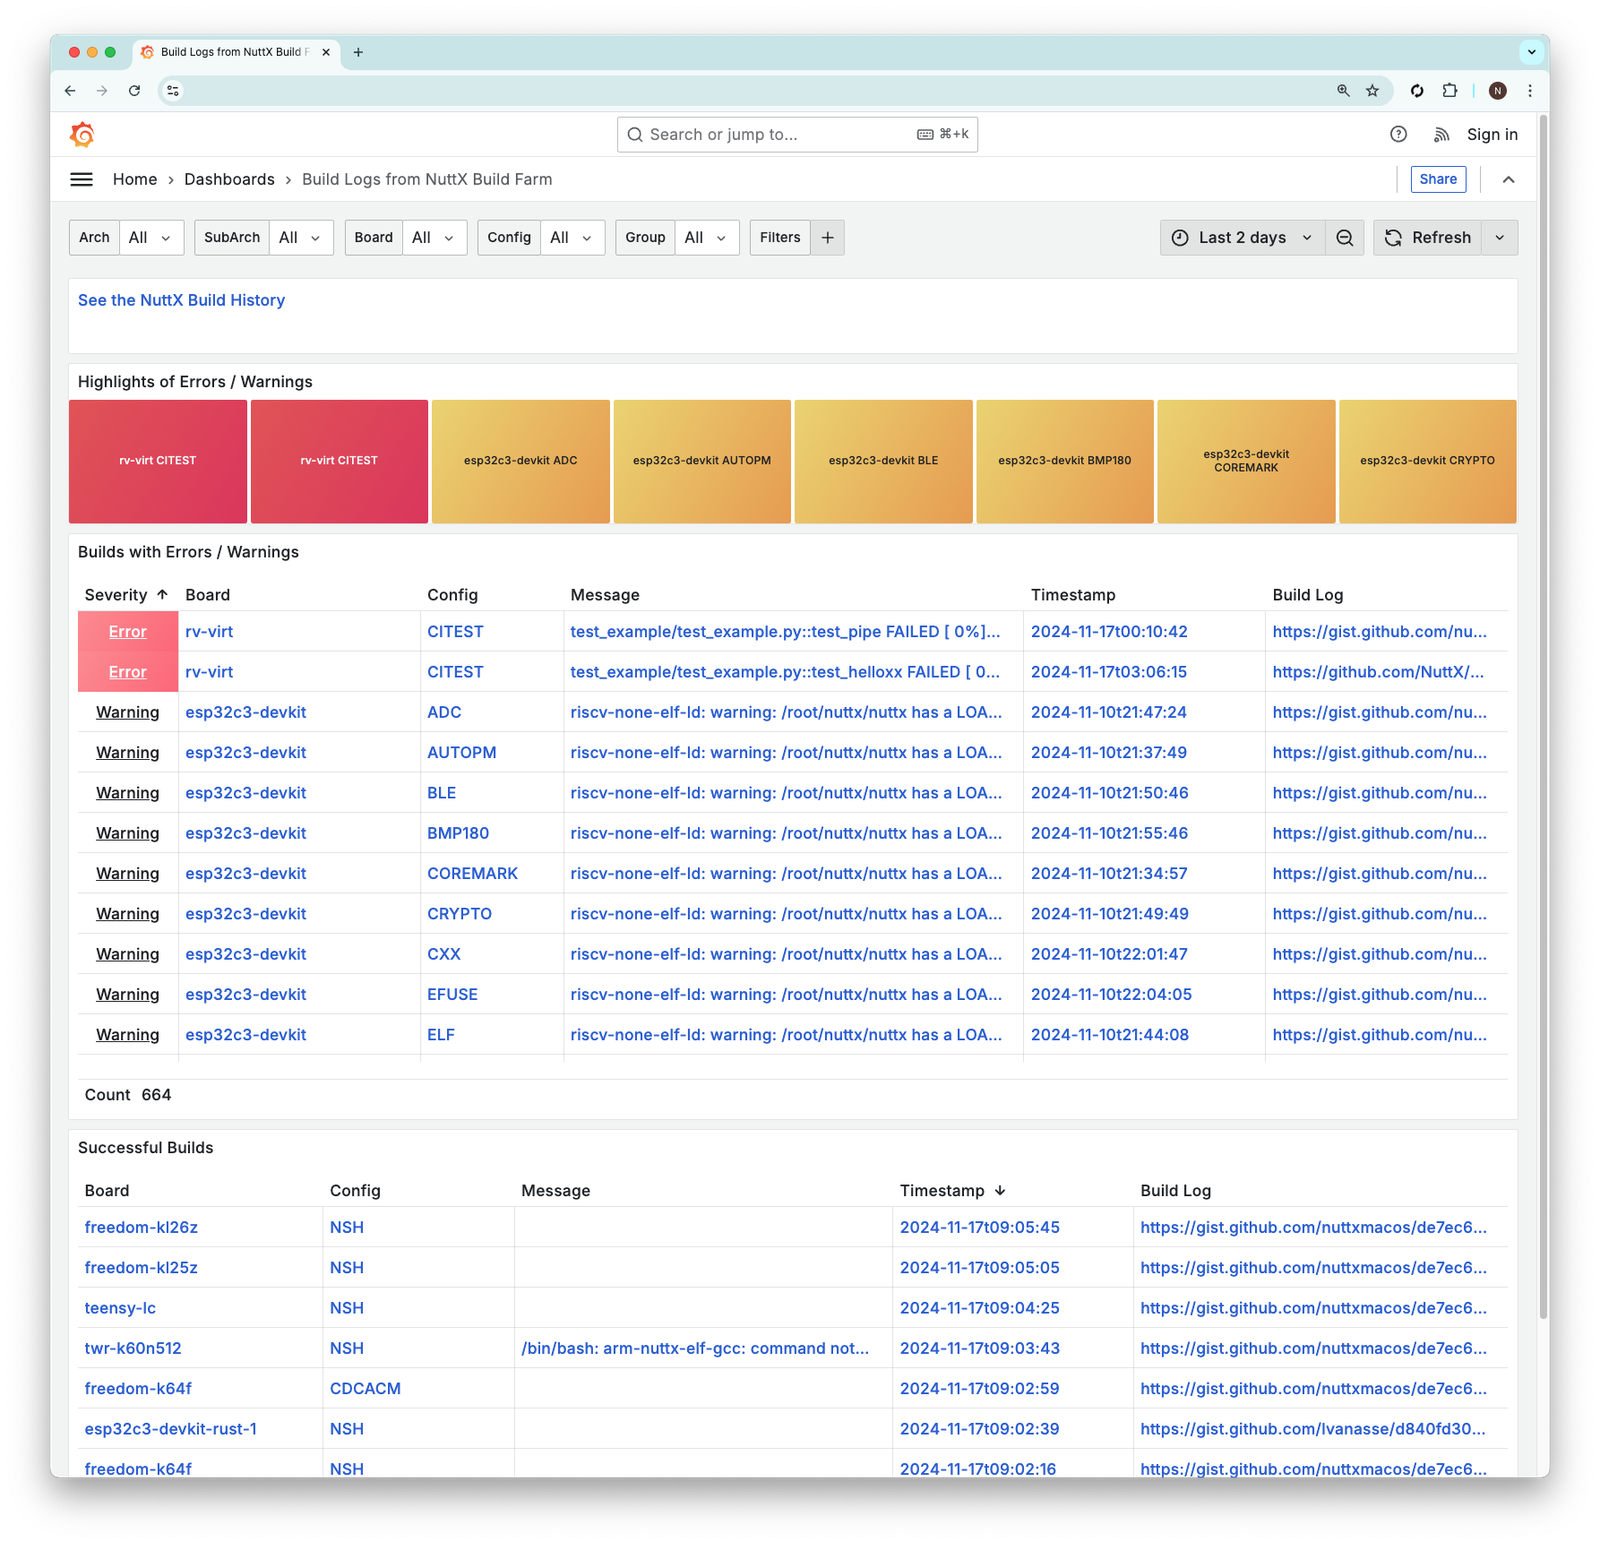
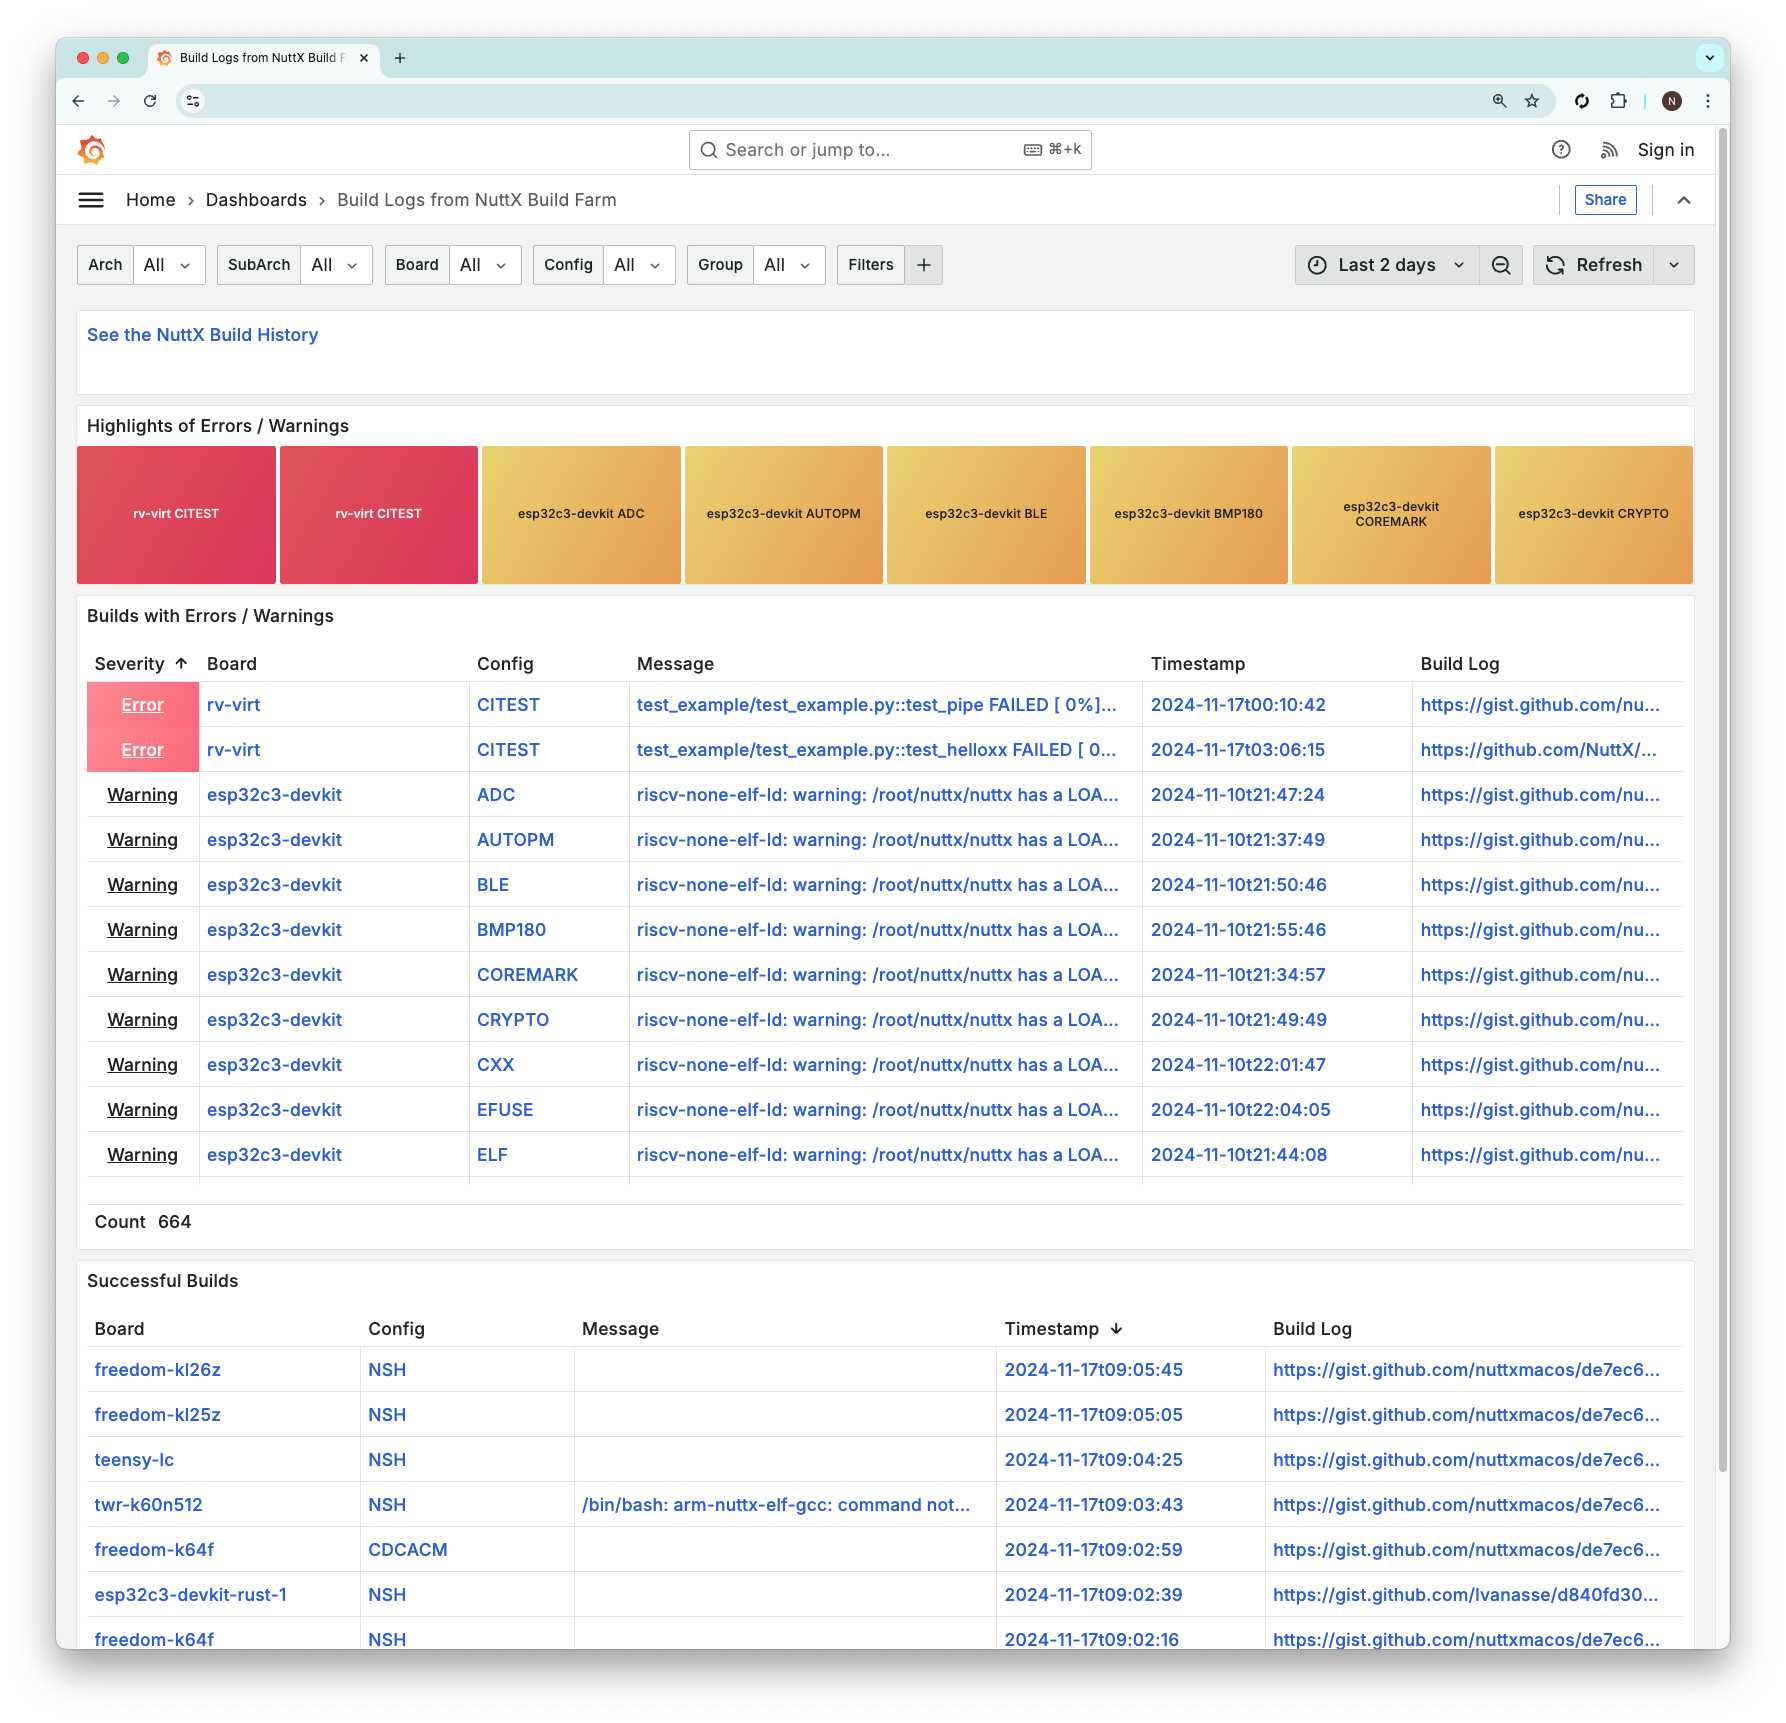
NuttX Dashboard shows a Snapshot of Failed Builds for the present moment. (Pic above)
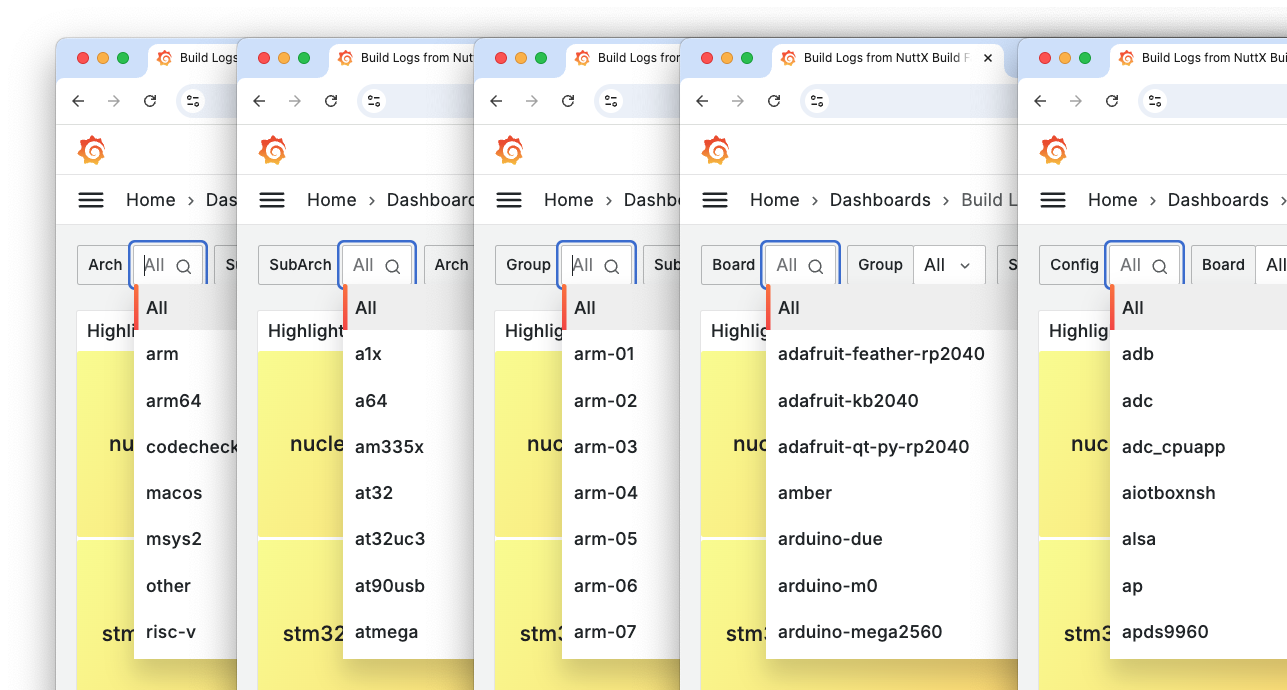
We may Filter the Builds by Architecture, Board and Config…
The snapshot includes builds from the (community-hosted) NuttX Build Farm as well as GitHub Actions (twice-daily builds).
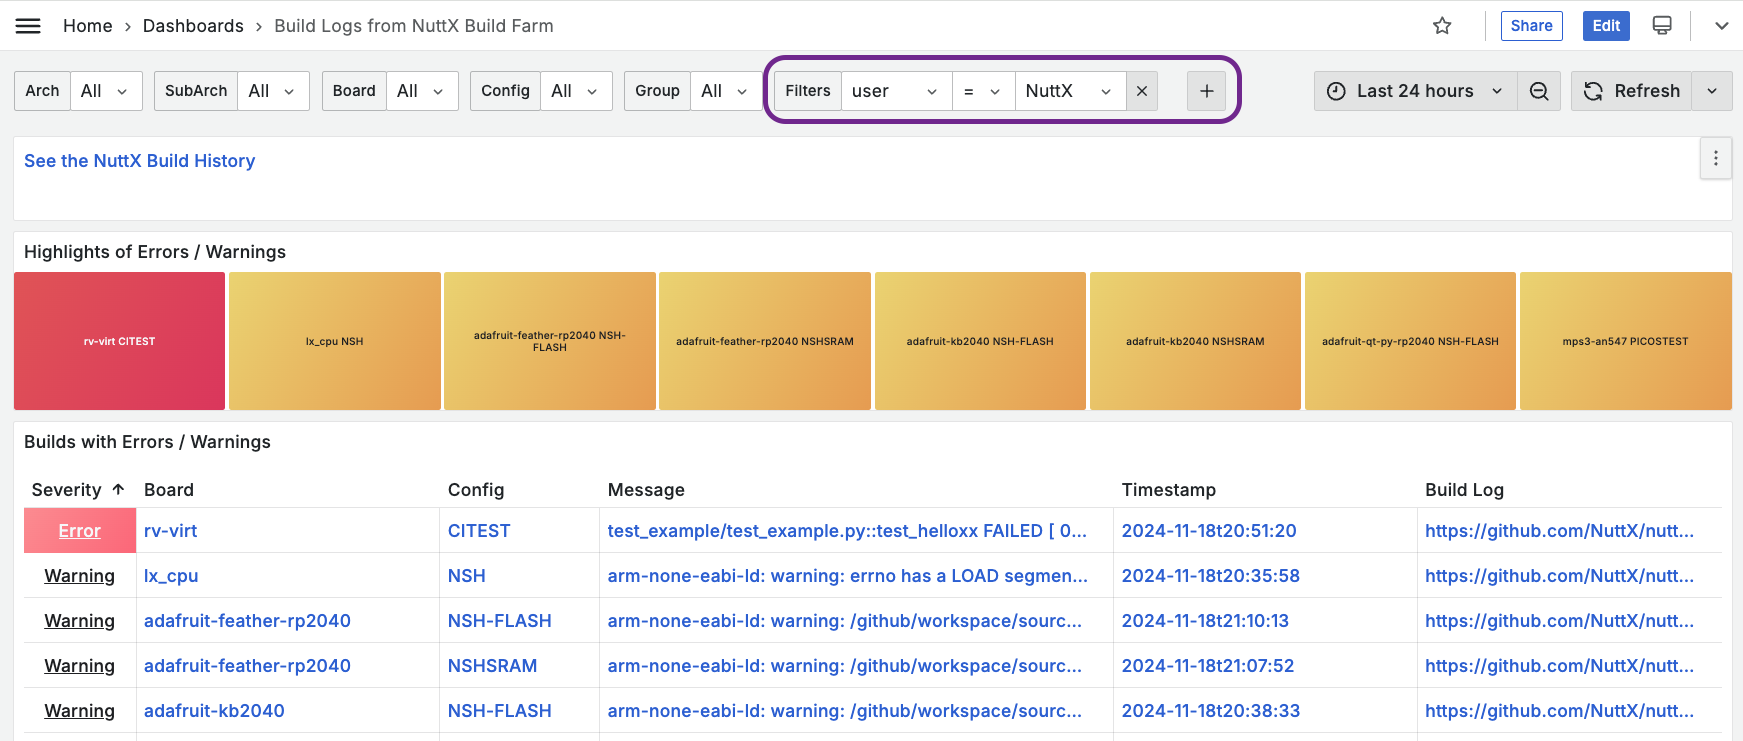
To see GitHub Actions Only: Click [+] and set User to NuttX…
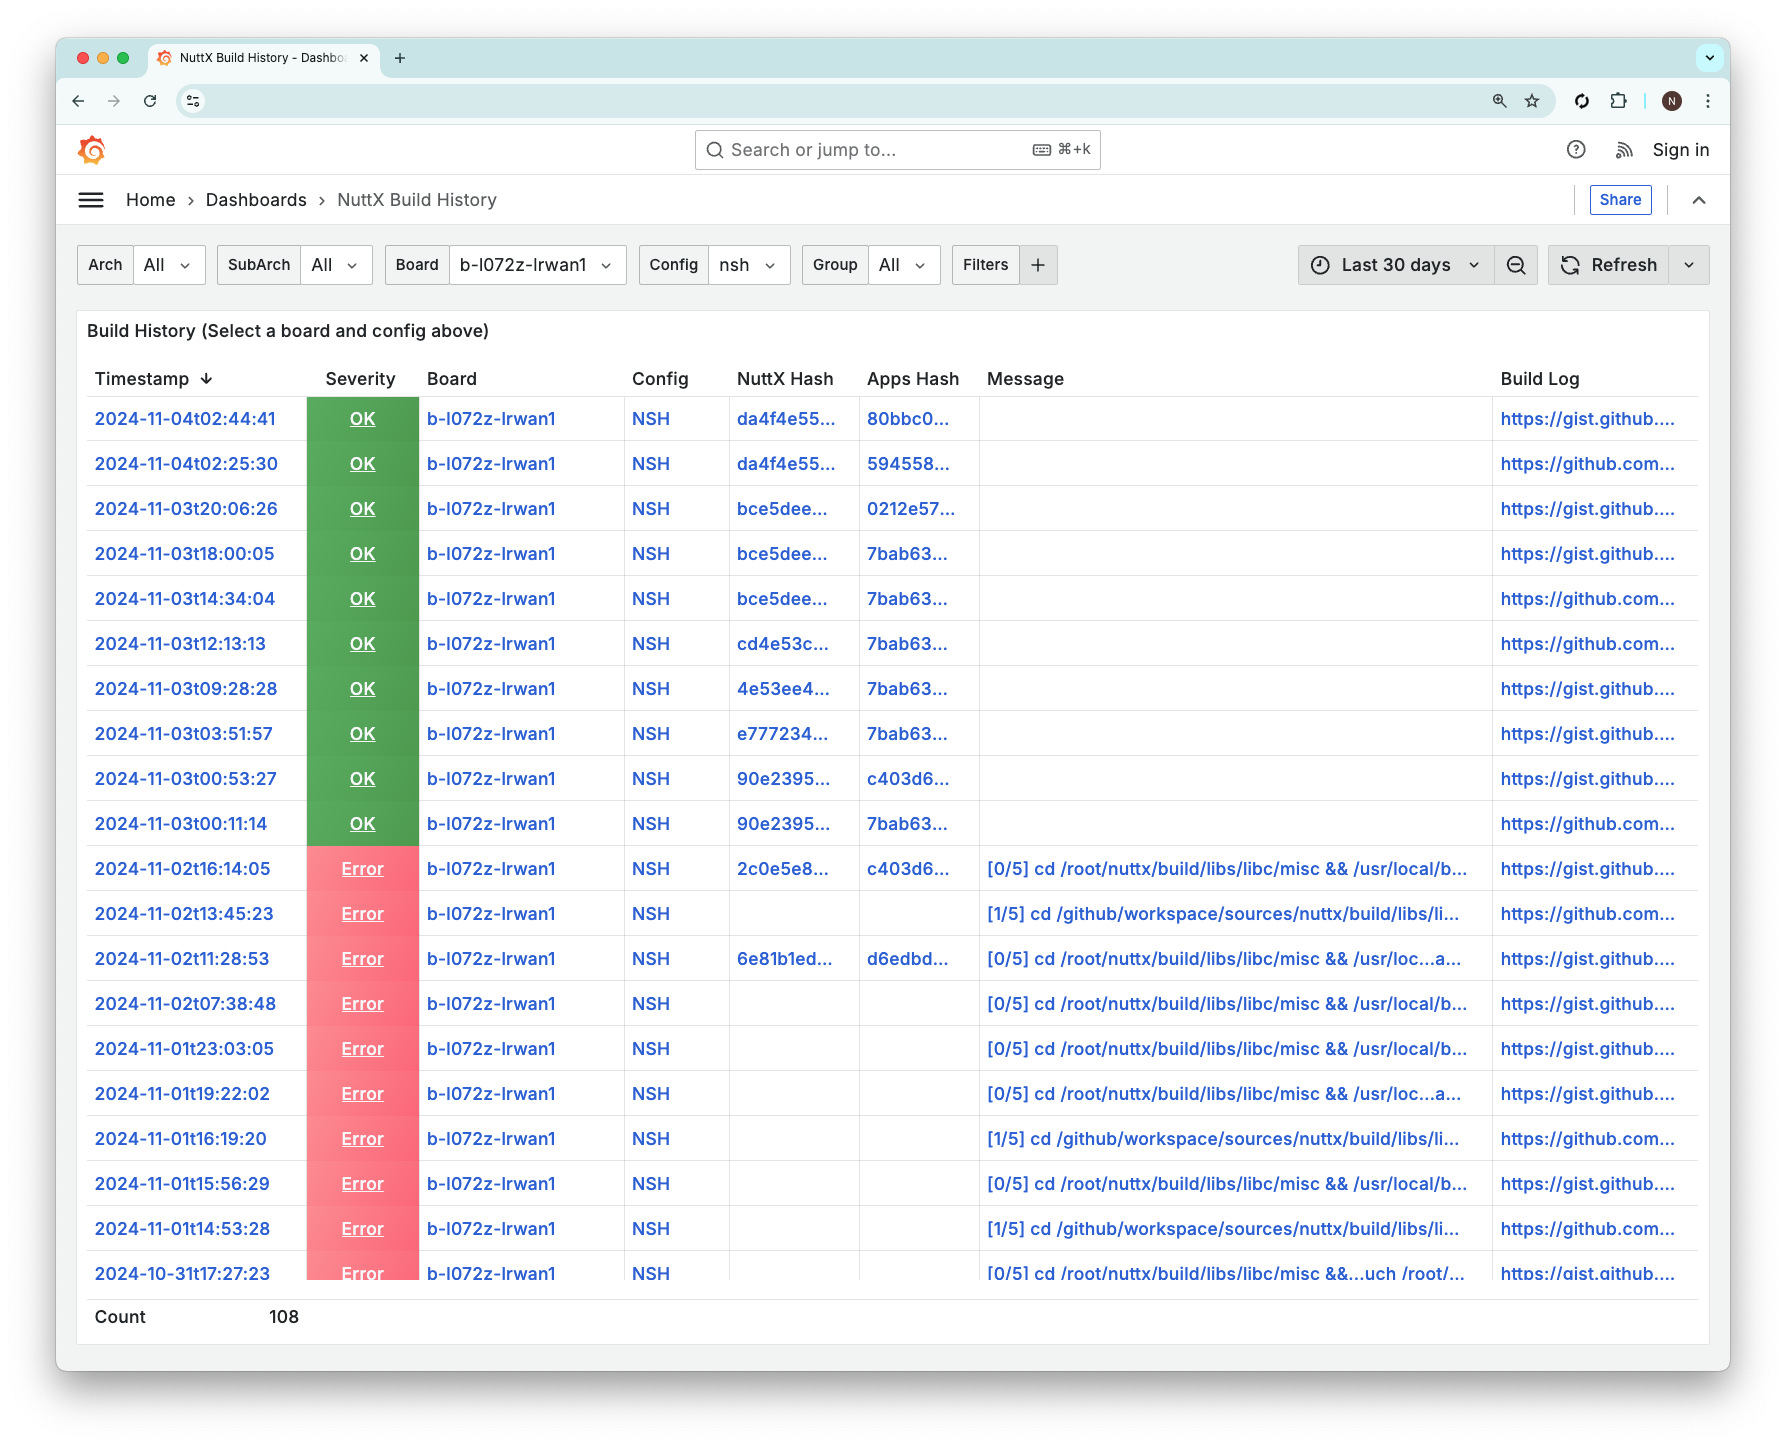
To see the History of Builds: Click the link for “NuttX Build History”. Remember to select the Board and Config. (Pic below)
Sounds Great! What’s the URL?
Sorry can’t print it here, our dashboard is under attack by WordPress Malware Bots (!). Please head over to NuttX Repo and seek NuttX-Dashboard. (Dog Tea? Organic!)
What’s this Build Score?
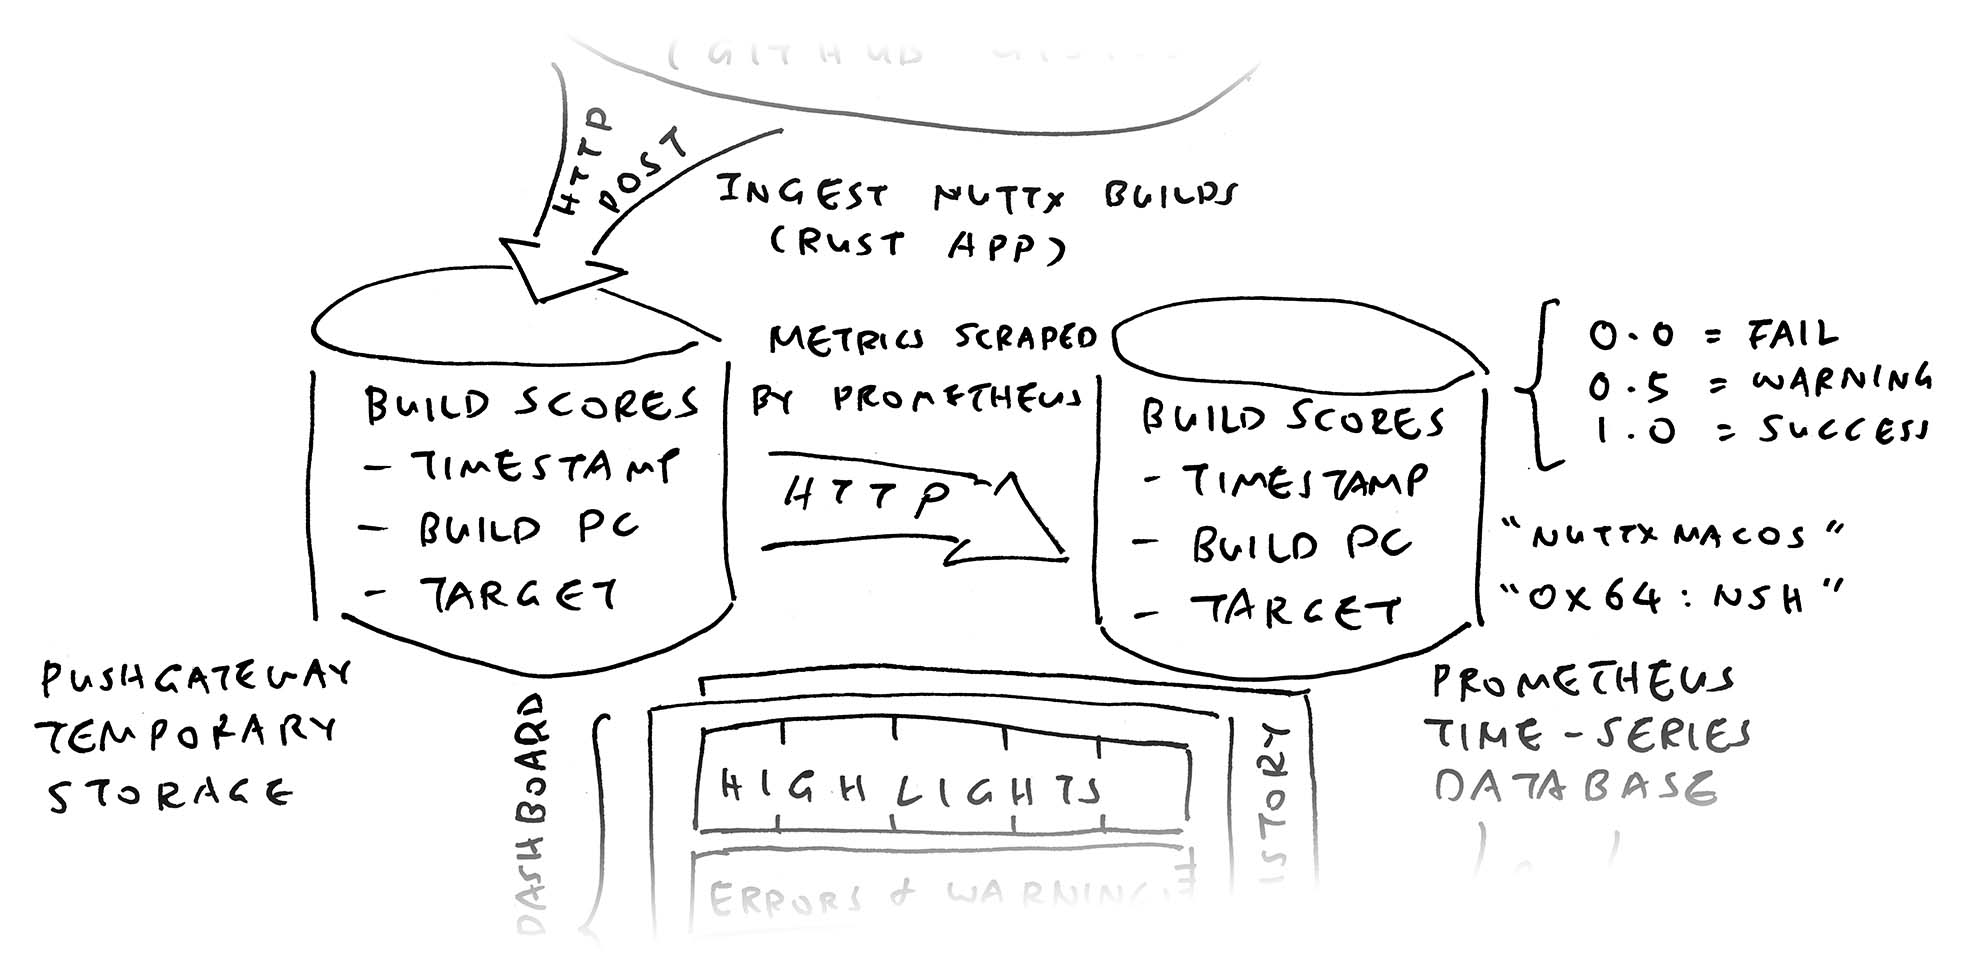
Our NuttX Dashboard needs to know the “Goodiness” of Every NuttX Build (pic above). Whether it’s a…
-
Total Fail: “undefined reference to atomic_fetch_add_2”
-
Warning: “nuttx has a LOAD segment with RWX permission”
-
Success: NuttX compiles and links OK
That’s why we assign a Build Score for every build…
| Score | Status | Example |
|---|---|---|
0.0 |
Error | undefined reference to atomic_fetch_add_2 |
0.5 |
Warning | nuttx has a LOAD segment with RWX permission |
0.8 |
Unknown | STM32_USE_LEGACY_PINMAP will be deprecated |
1.0 |
Success | (No Errors and Warnings) |
Which makes it simpler to Colour-Code our Dashboard: Green (Success) / Yellow (Warning) / Red (Error).
Sounds easy? But we’ll catch Multiple Kinds of Errors (in various formats)
-
Compile Errors: “return with no value”
-
Linker Errors: “undefined reference to atomic_fetch_add_2”
-
Config Errors: “modified: sim/configs/rtptools/defconfig”
-
Network Errors: “curl 92 HTTP/2 stream 0 was not closed cleanly”
-
CI Test Failures: “test_pipe FAILED”
Doesn’t the Build Score vary over time?
Yep the Build Score is actually a Time Series Metric! It will have the following dimensions…
-
Timestamp: When the NuttX Build was executed (2024-11-24T00:00:00)
-
User: Whose PC executed the NuttX Build (nuttxpr)
-
Target: NuttX Target that we’re building (milkv_duos:nsh)
Which will fold neatly into this URL, as we’ll soon see…
localhost:9091/metrics/job/nuttxpr/instance/milkv_duos:nsh
Where do we store the Build Scores?
Inside a special open-source Time Series Database called Prometheus.
We’ll come back to Prometheus, first we study the Dashboard…
What’s this Grafana?
Grafana is an open-source toolkit for creating Monitoring Dashboards.
Sadly there isn’t a “programming language” for coding Grafana. Thus we walk through the steps to create our NuttX Dashboard with Grafana…
## Install Grafana on Ubuntu
## See https://grafana.com/docs/grafana/latest/setup-grafana/installation/debian/
sudo apt install grafana
sudo systemctl start grafana-server

## Or macOS
brew install grafana
brew services start grafana

## Browse to http://localhost:3000
## Login as `admin` for username and password
-
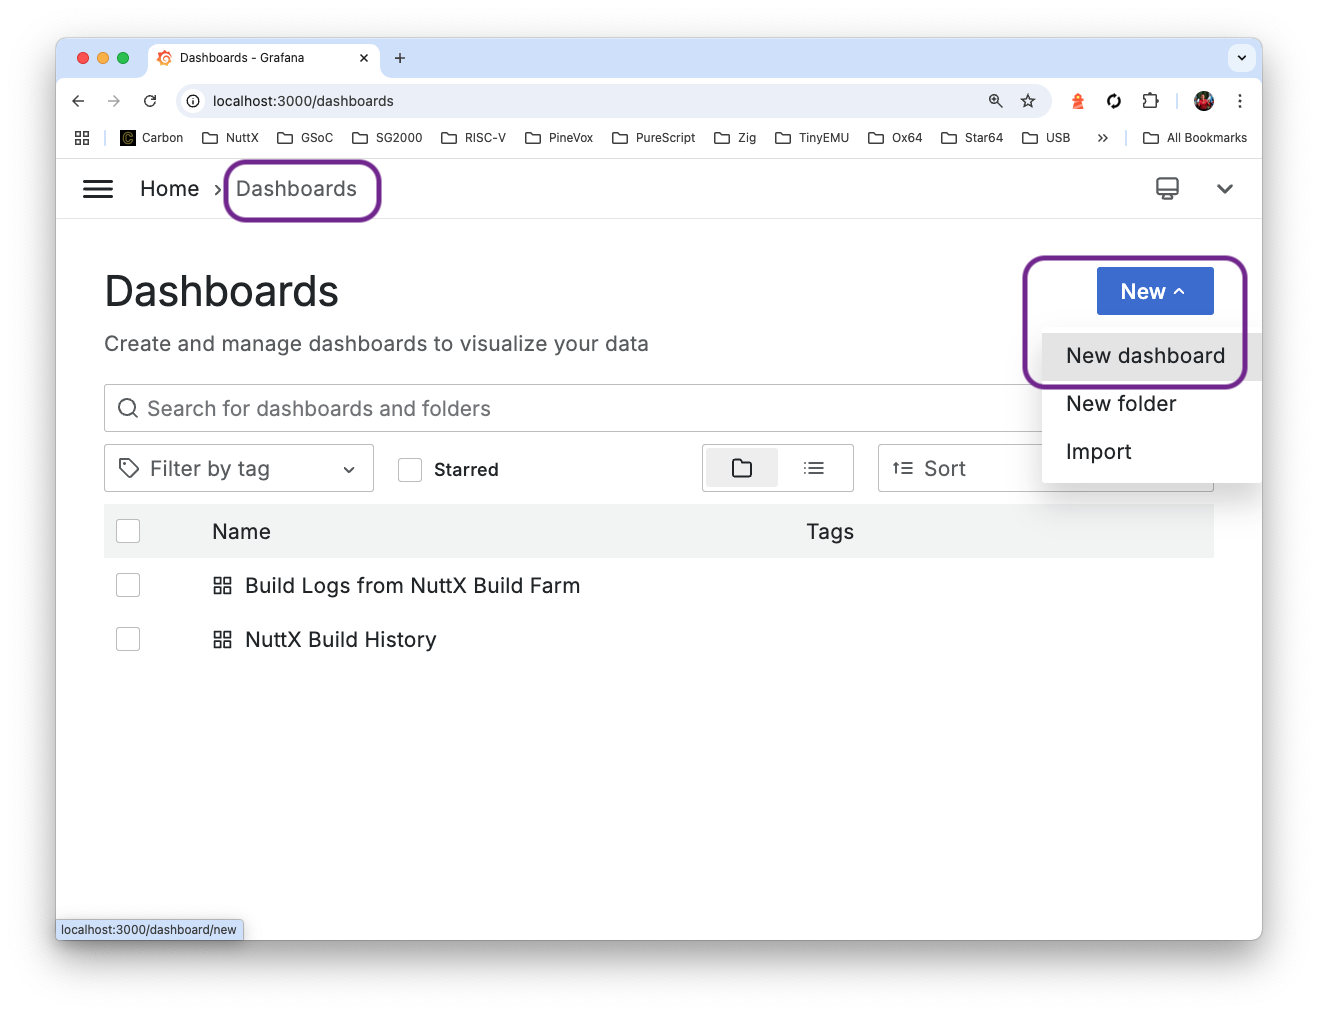
Inside Grafana: We create a New Dashboard…
-
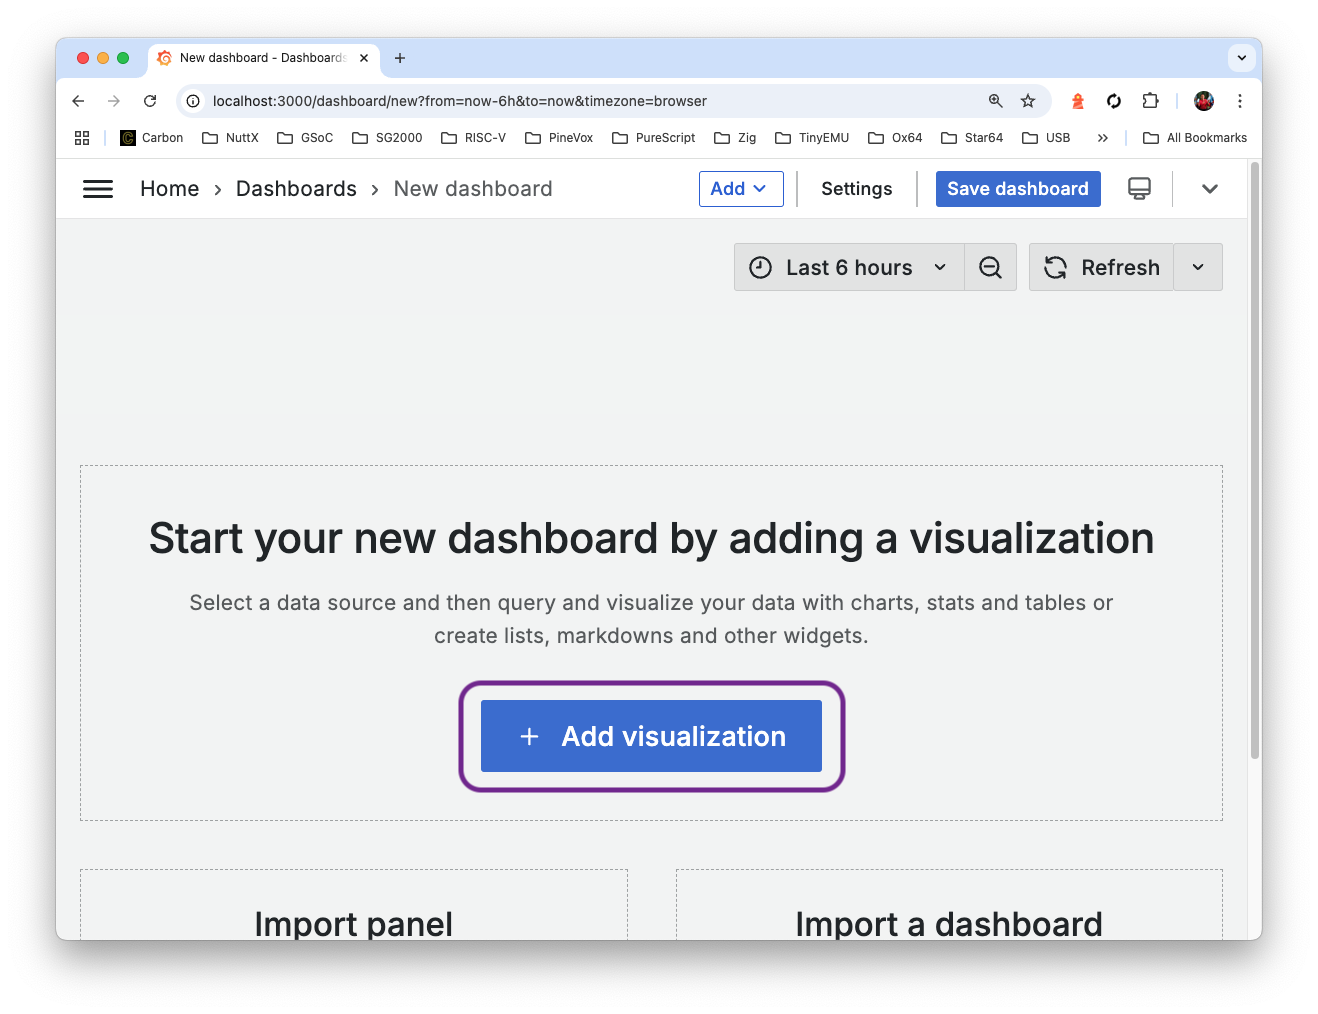
Add a Visualisation…
-
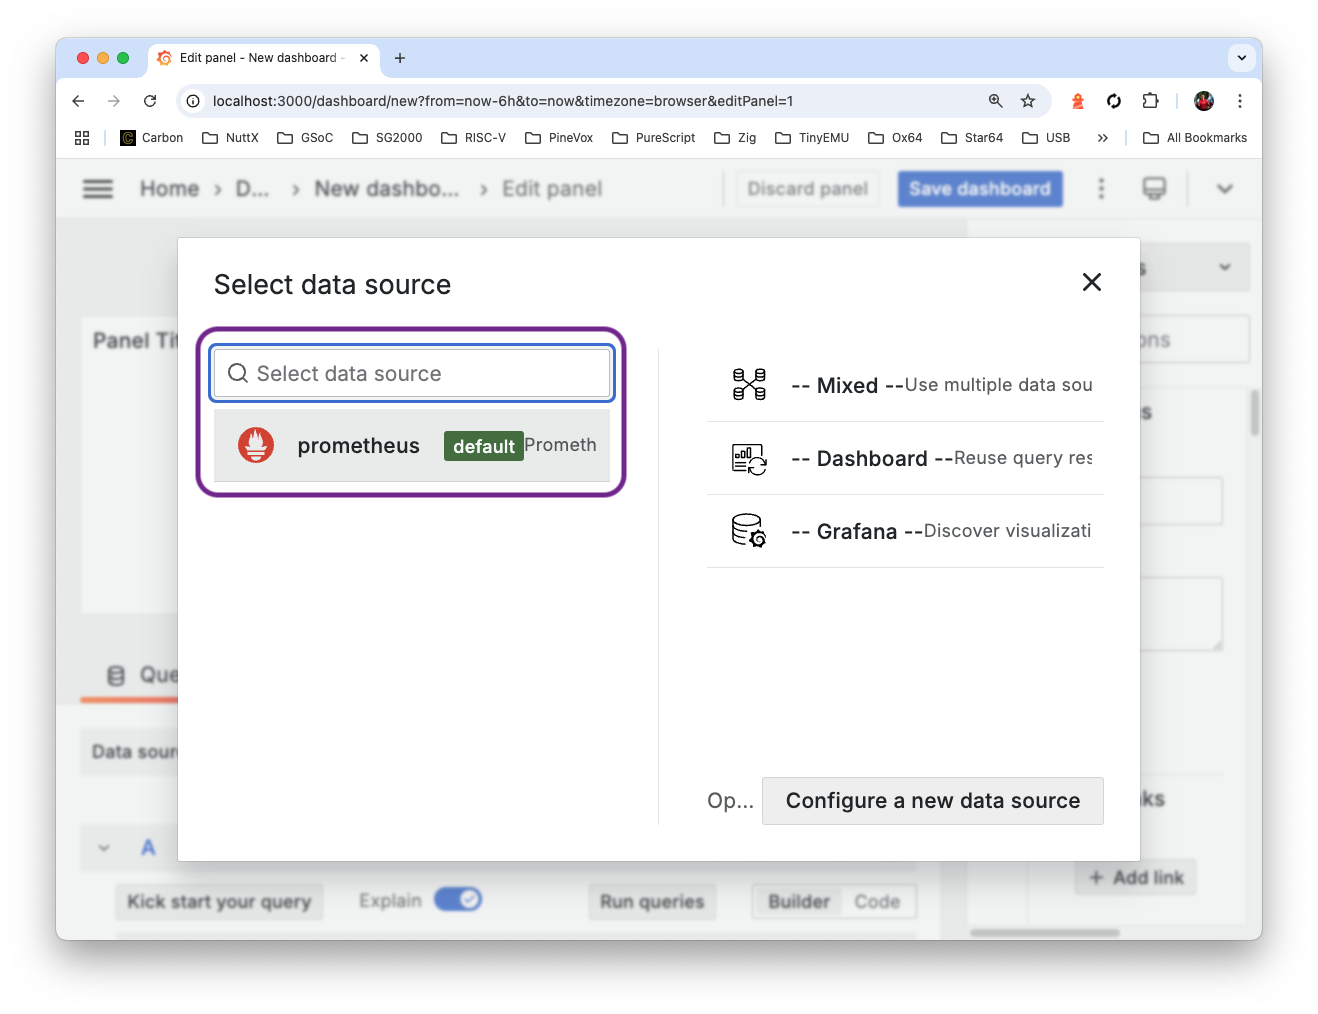
Select the Prometheus Data Source (we’ll explain why)
-
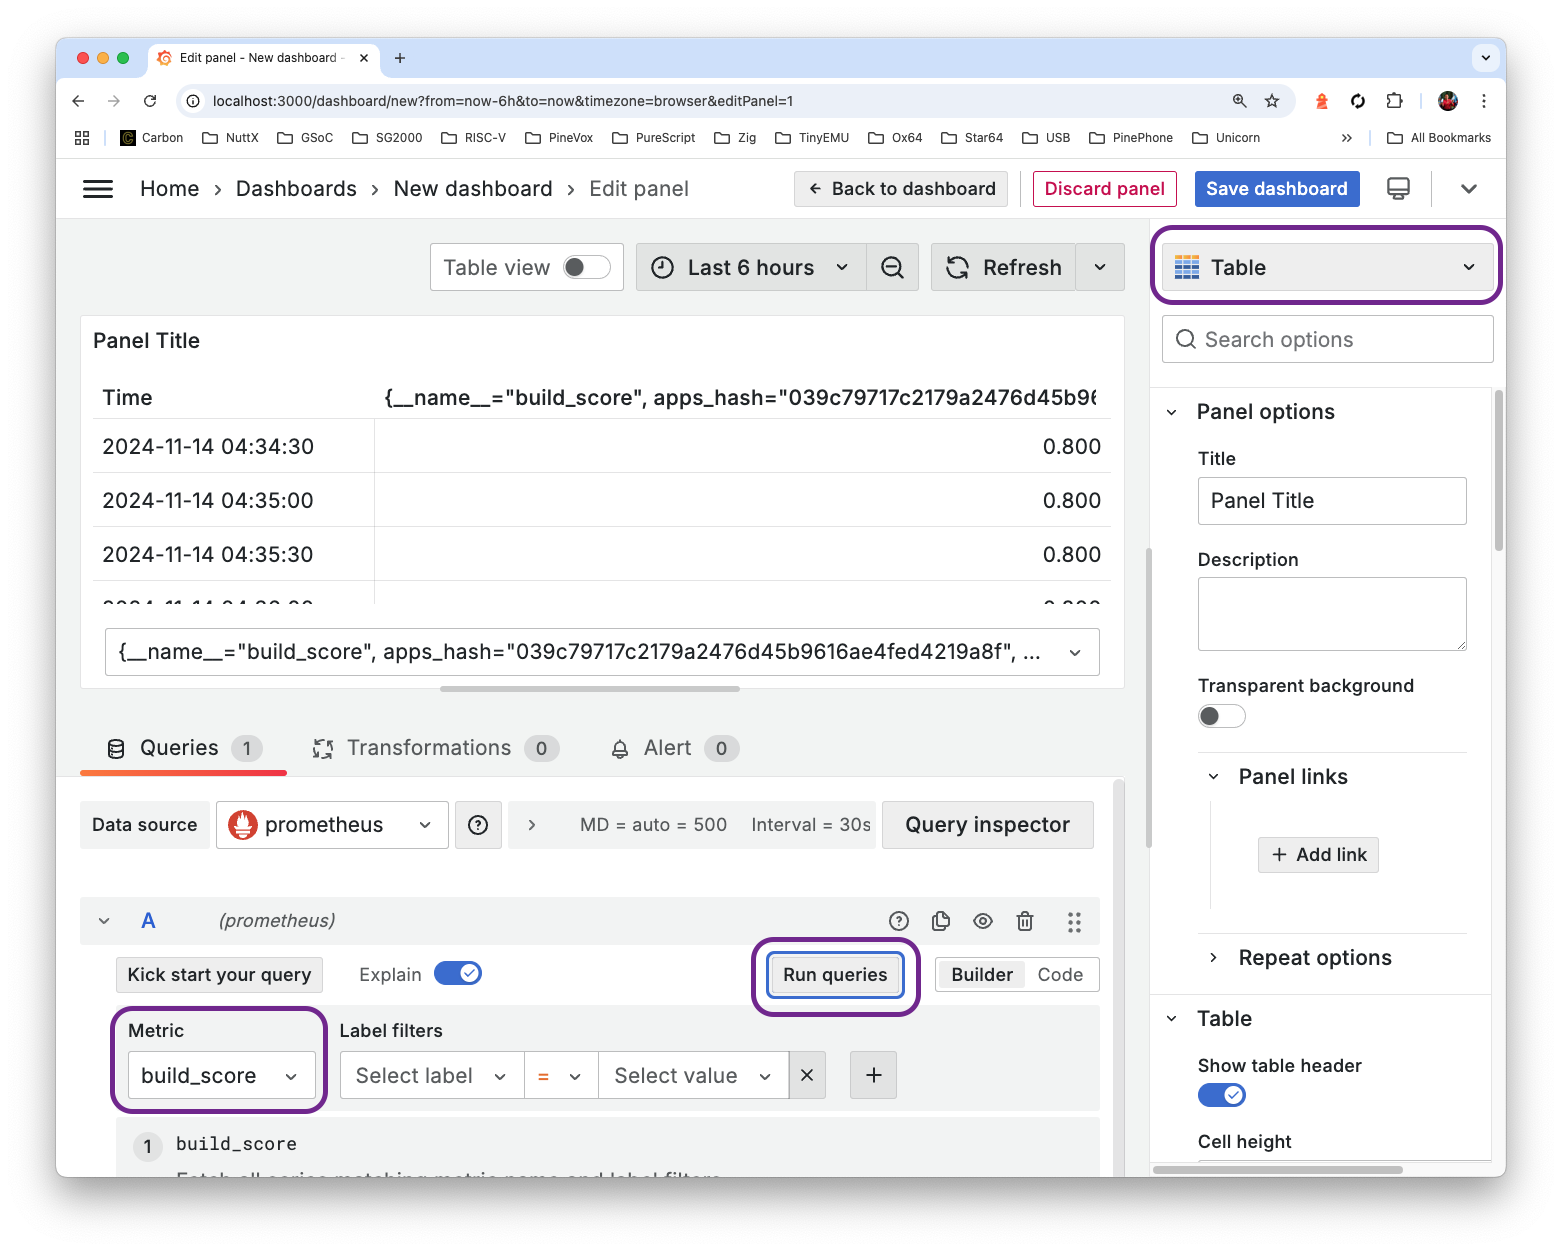
Change the Visualisation to “Table” (top right)
Choose Build Score as the Metric. Click “Run Queries”…
-
We see a list of Build Scores in the Data Table above.
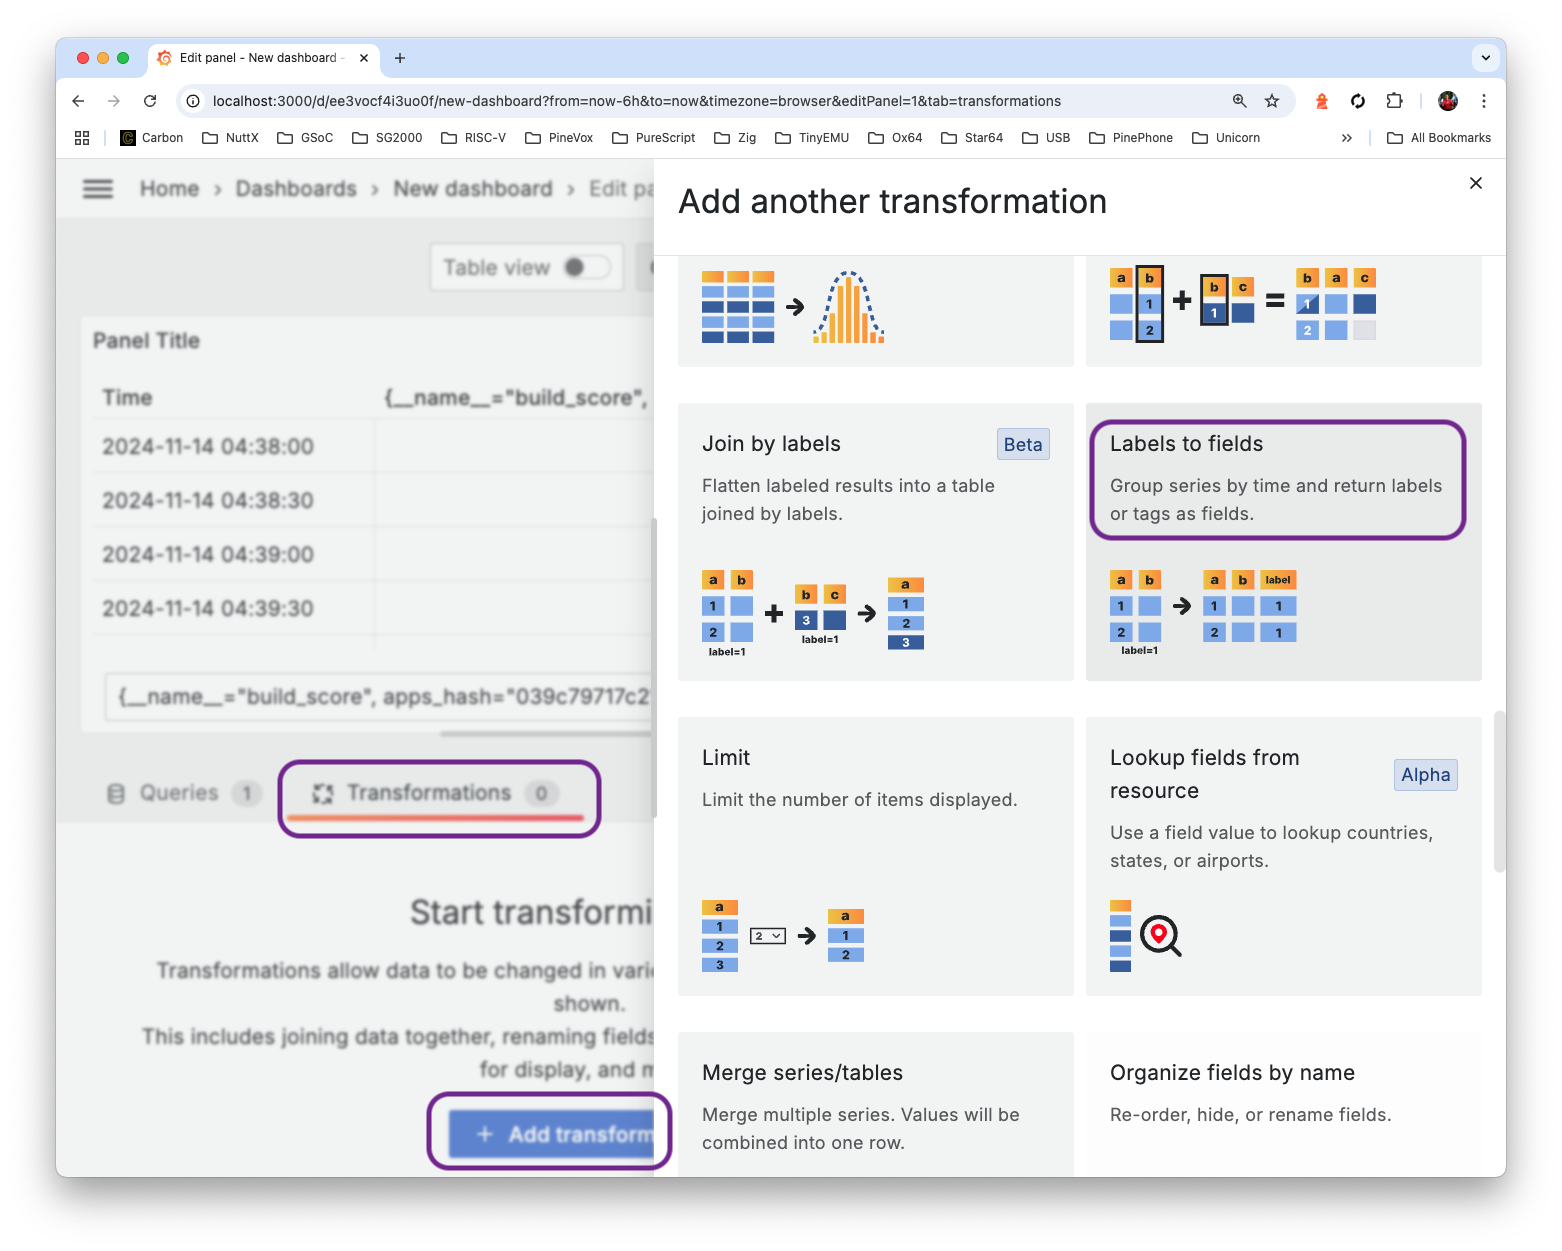
But where’s the Timestamp, Board and Config?
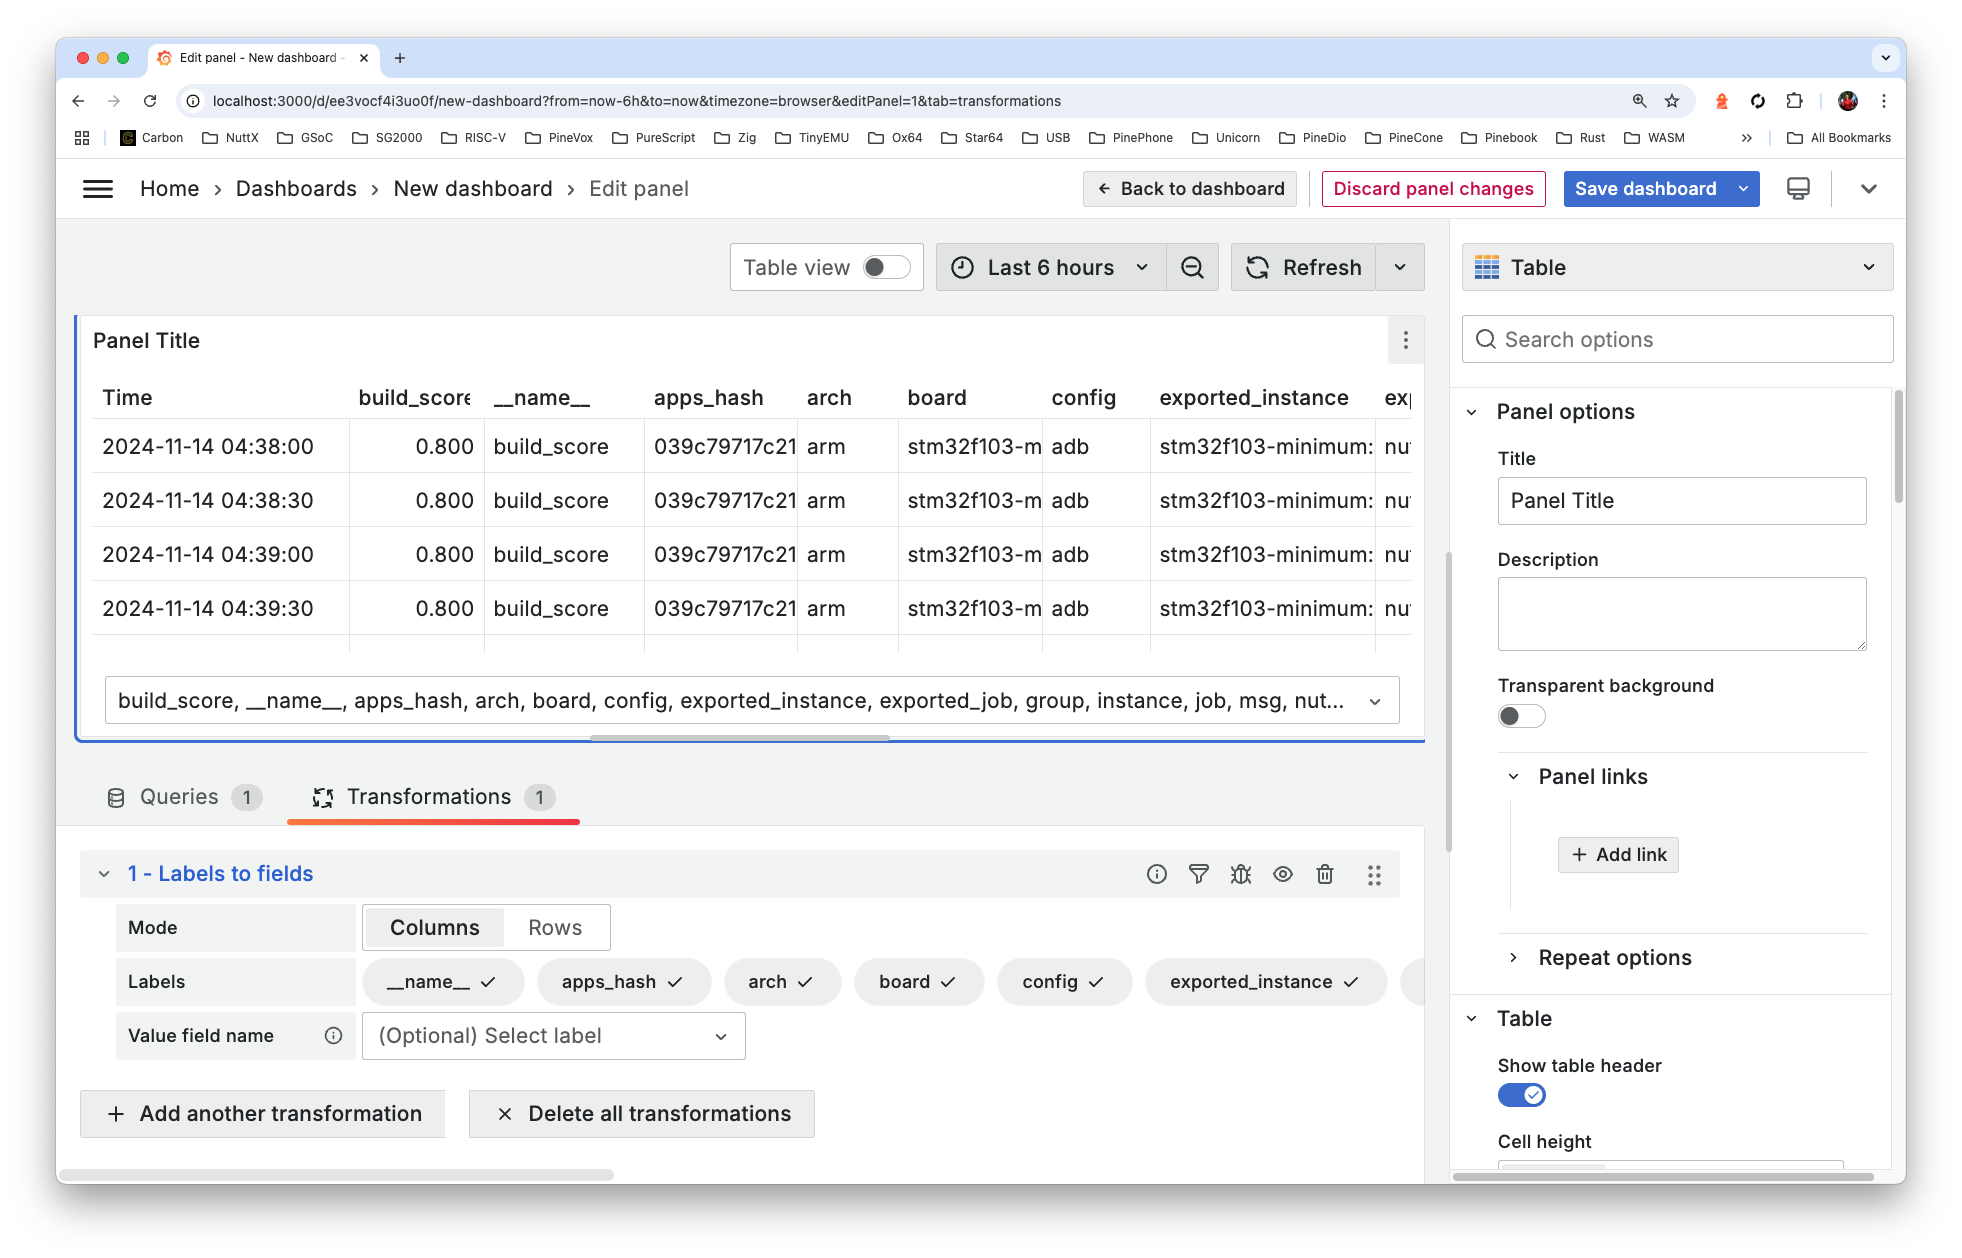
That’s why we do Transformations > Add Transformation > Labels To Fields
-
And the data appears! Timestamp, Board, Config, …
-
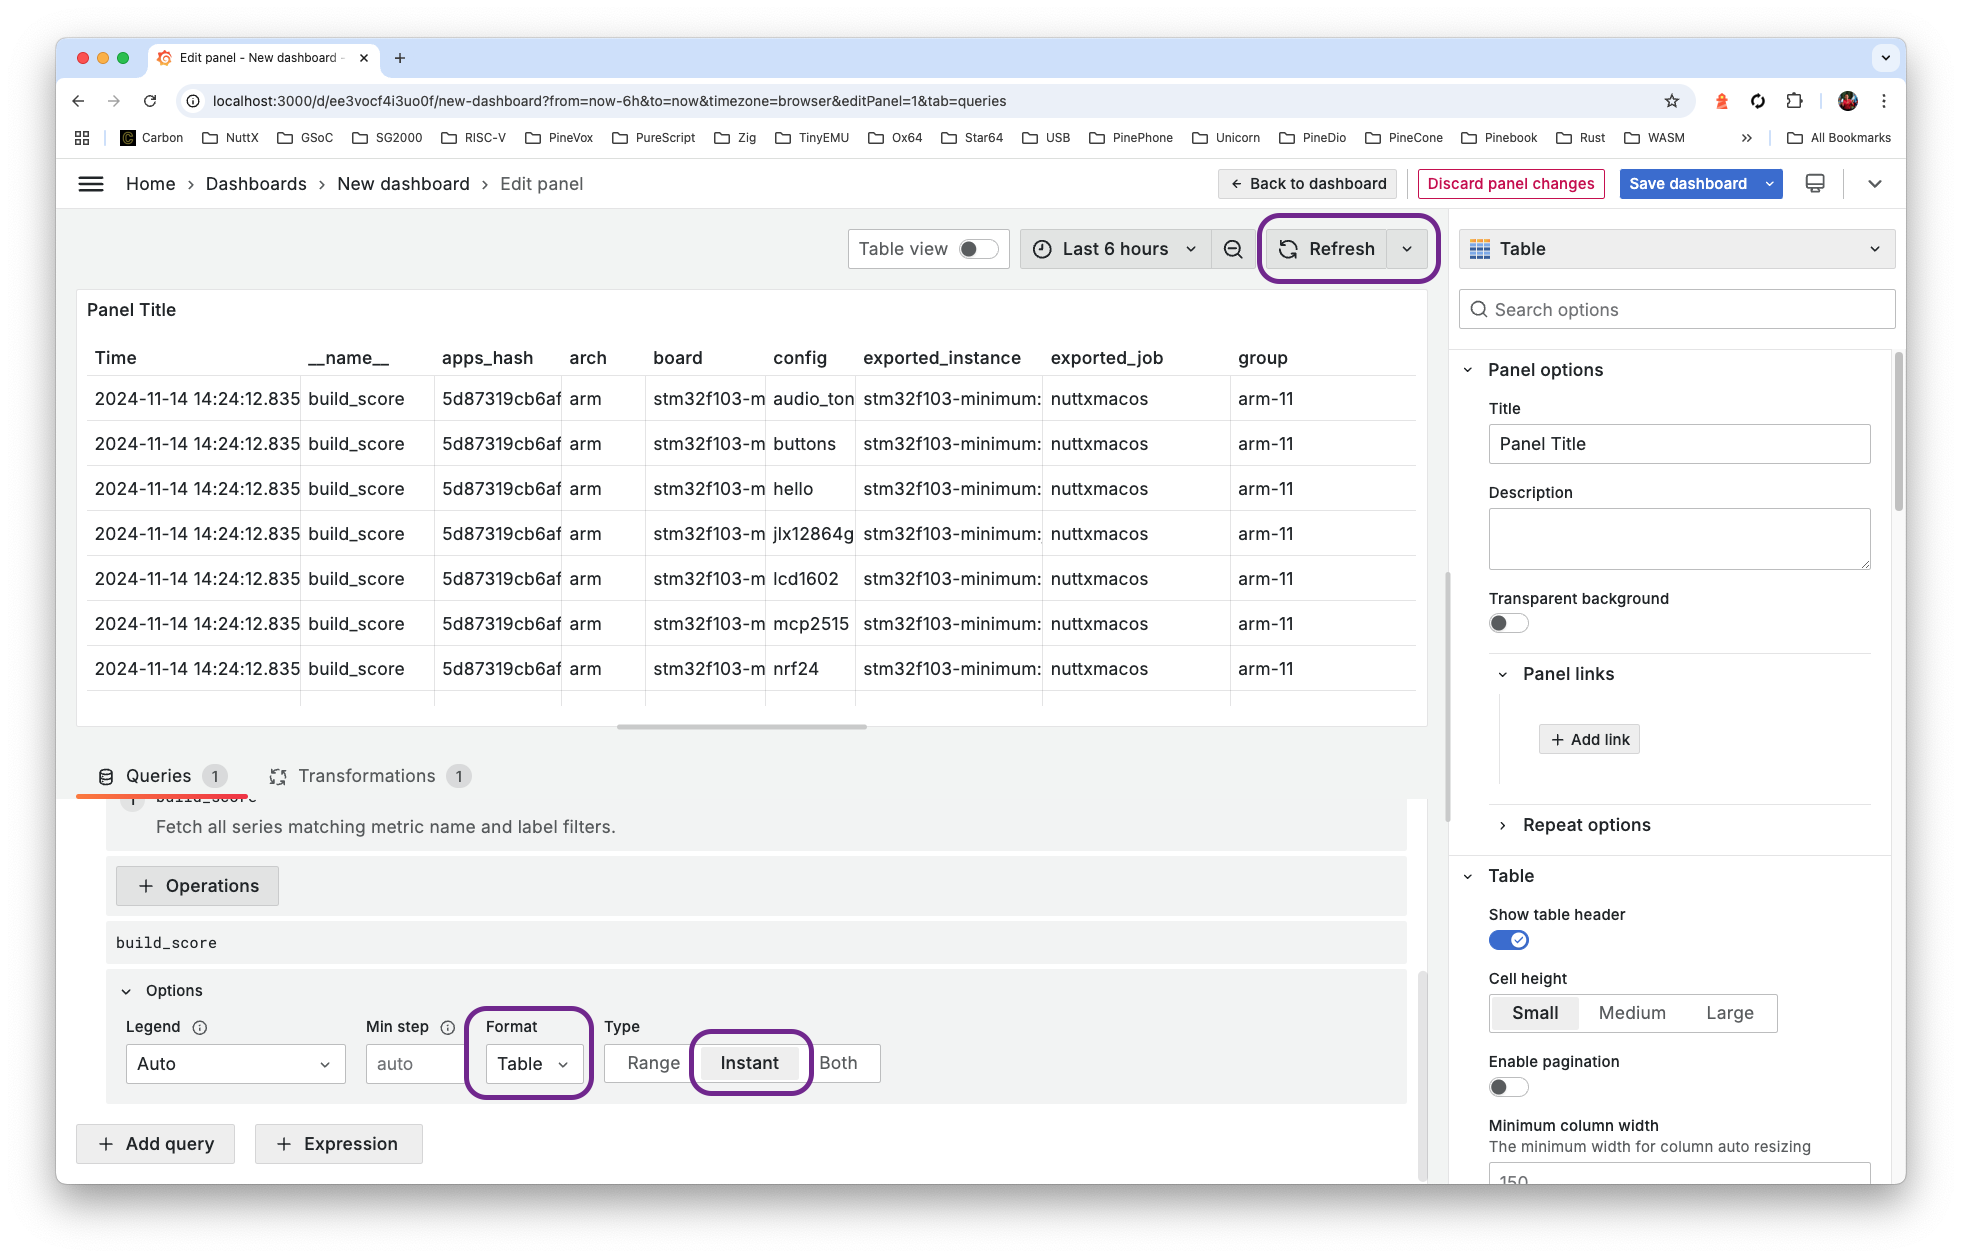
Hmmm it’s the same Board and Config… Just different Timestamps.
We click Queries > Format: Table > Type: Instant > Refresh
-
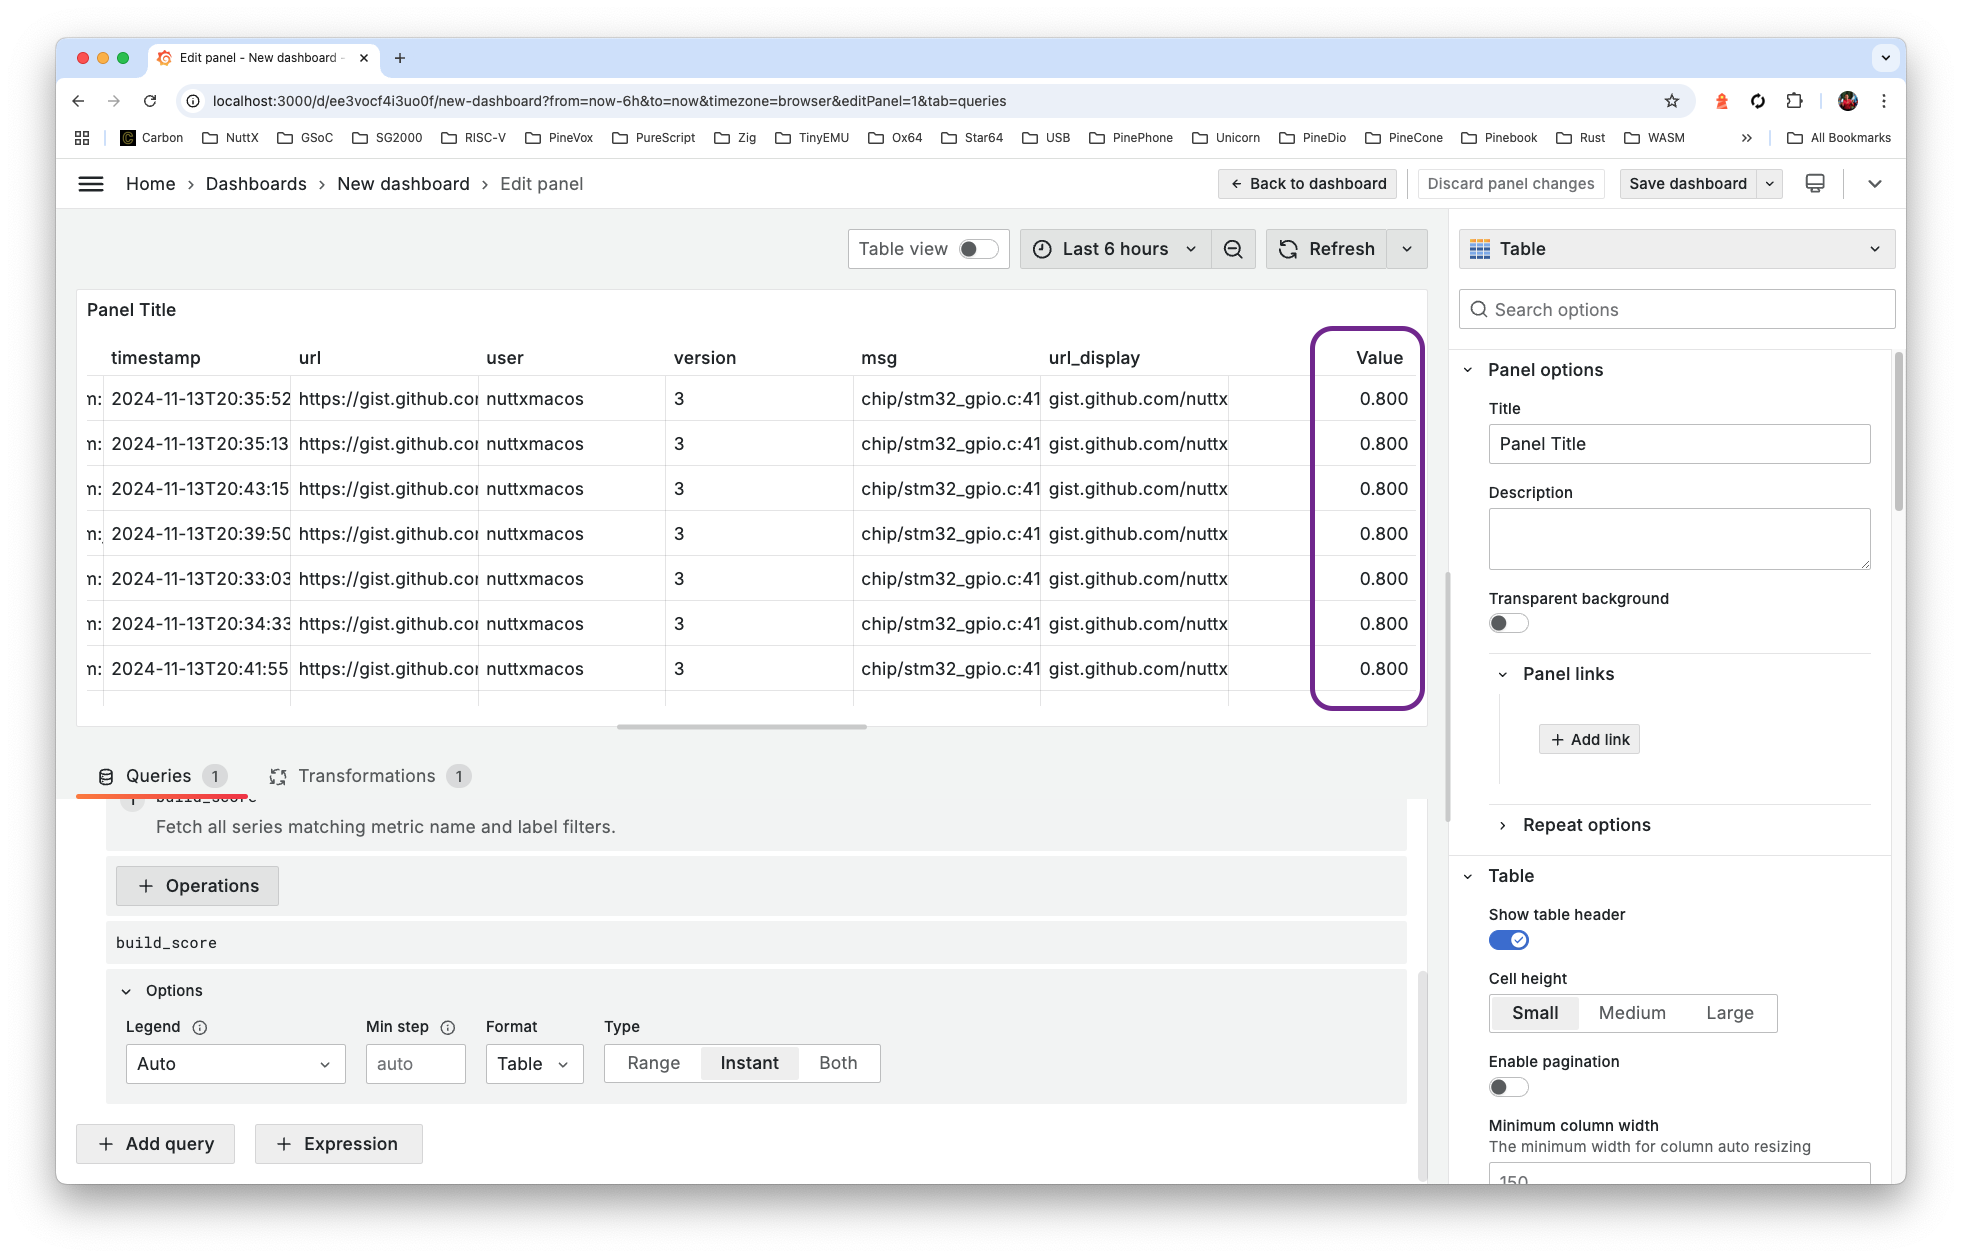
Much better! We see the Build Score at the End of Each Row (to be colourised)
-
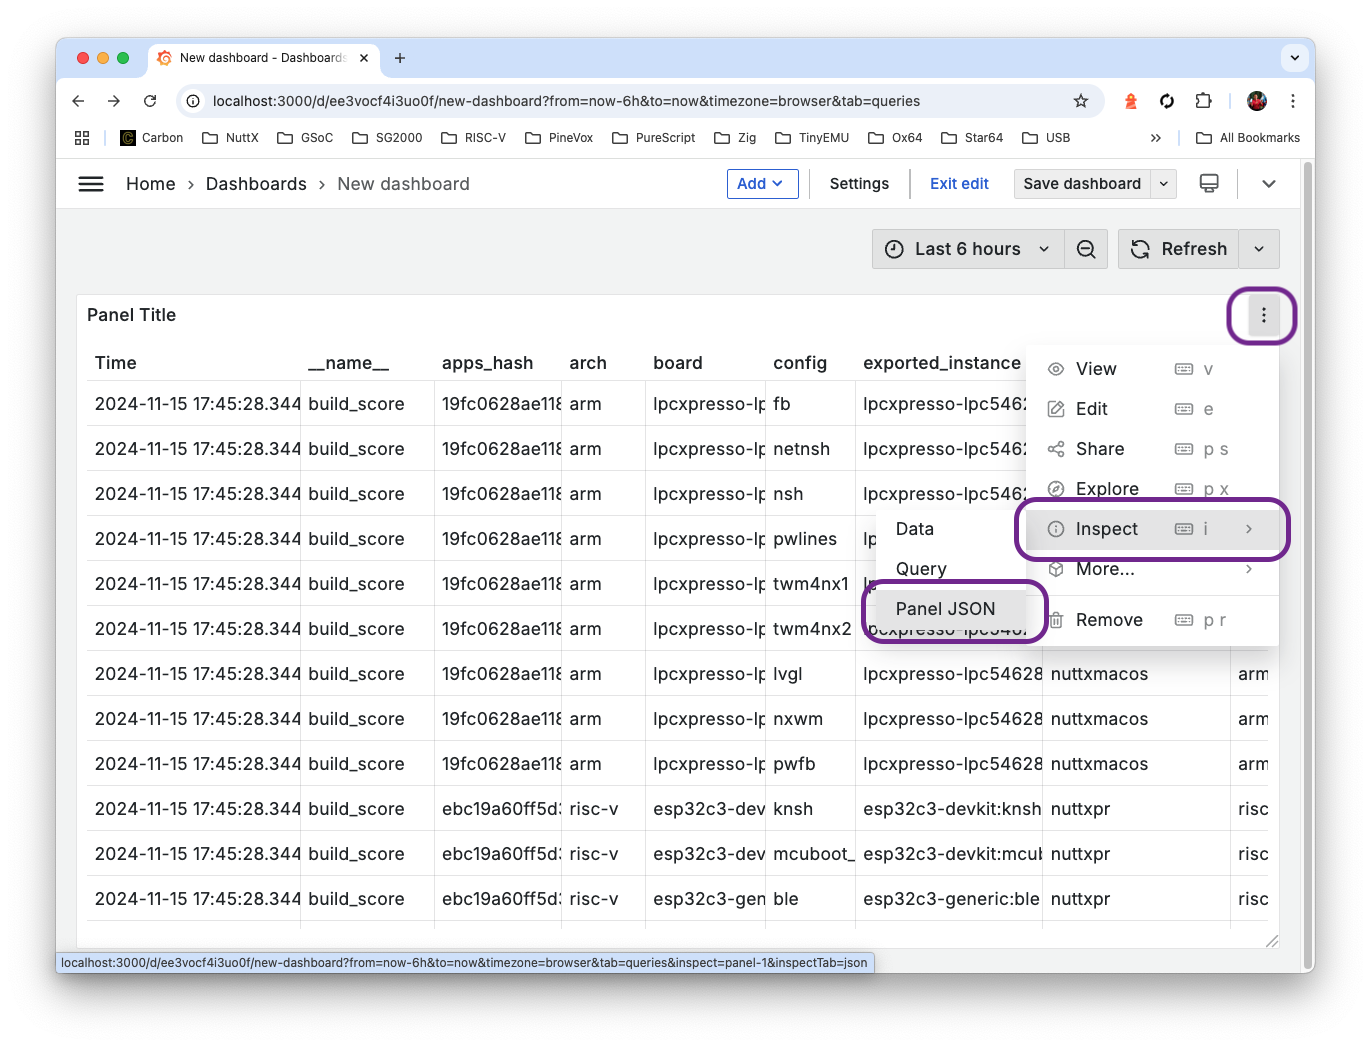
Our NuttX Deashboard is nearly ready. To check our progress: Click Inspect > Panel JSON
-
And compare with our Completed Panel JSON…
-
How to get there? Watch the steps…
We saw the setup for Grafana Dashboard. What about the Prometheus Metrics?
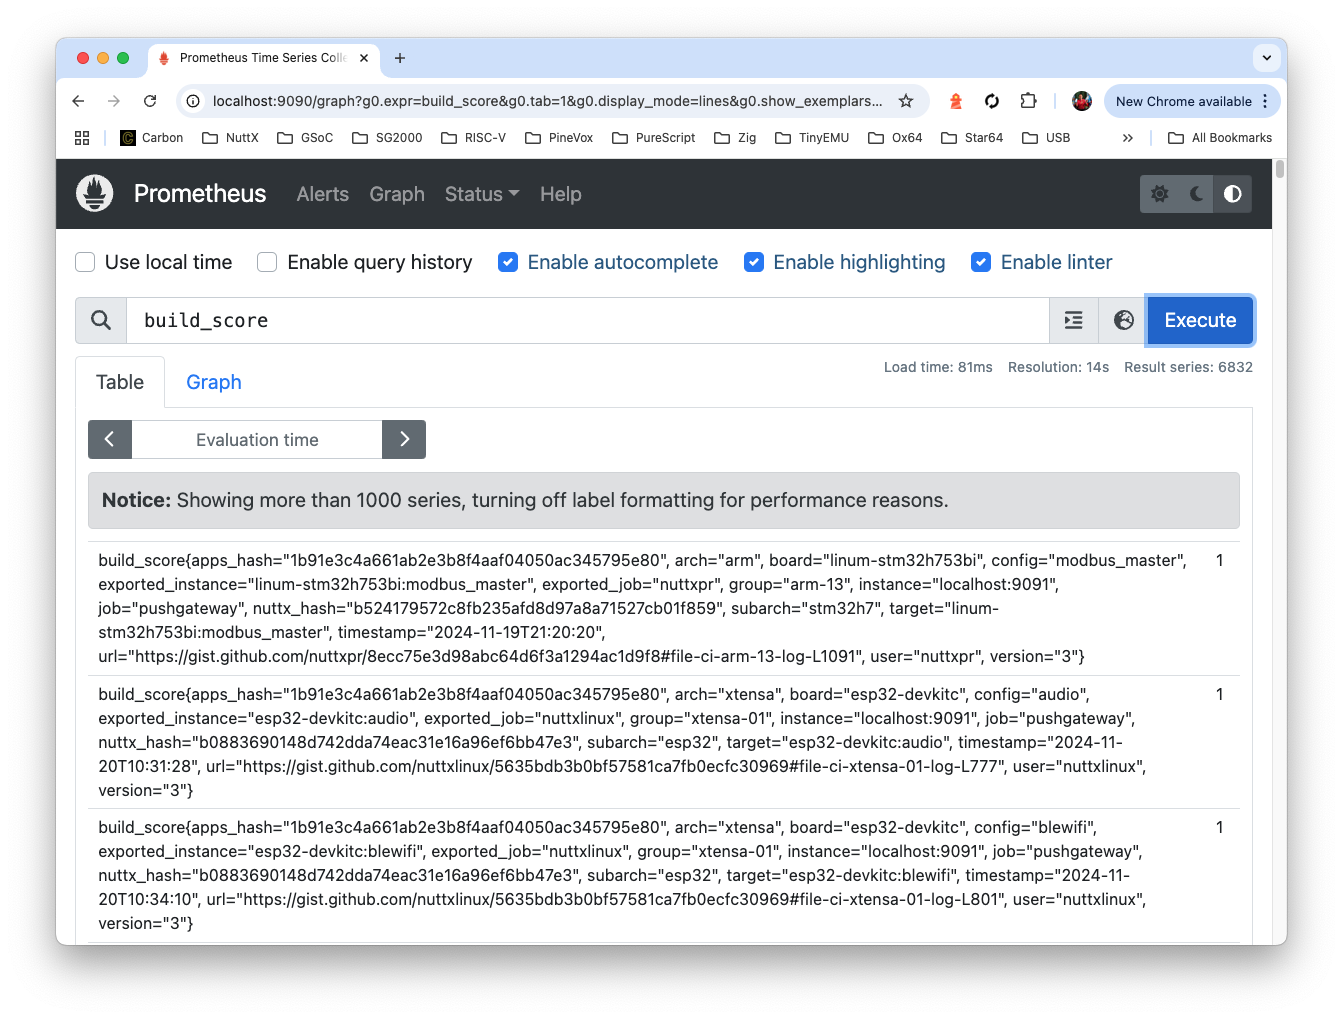
Remember that our Build Scores are stored inside a special (open-source) Time Series Database called Prometheus.
This is how we install Prometheus…
## Install Prometheus on Ubuntu
sudp apt install prometheus
sudo systemctl start prometheus

## Or macOS
brew install prometheus
brew services start prometheus

## TODO: Update the Prometheus Config
## Edit /etc/prometheus/prometheus.yml (Ubuntu)
## Or /opt/homebrew/etc/prometheus.yml (macOS)

## Replace by contents of
## https://github.com/lupyuen/ingest-nuttx-builds/blob/main/prometheus.yml

## Restart Prometheus
sudo systemctl restart prometheus ## Ubuntu
brew services restart prometheus  ## macOS

## Check that Prometheus is up
## http://localhost:9090
Prometheus looks like this…
Recall that we assign a Build Score for every build…
| Score | Status | Example |
|---|---|---|
0.0 |
Error | undefined reference to atomic_fetch_add_2 |
0.5 |
Warning | nuttx has a LOAD segment with RWX permission |
0.8 |
Unknown | STM32_USE_LEGACY_PINMAP will be deprecated |
1.0 |
Success | (No Errors and Warnings) |
This is how we Load a Build Score into Prometheus…
## Install GoLang
sudo apt install golang-go ## For Ubuntu
brew install go  ## For macOS

## Install Pushgateway
git clone https://github.com/prometheus/pushgateway
cd pushgateway
go run main.go

## Check that Pushgateway is up
## http://localhost:9091

## Load a Build Score into Pushgateway
## Build Score is 0 for User nuttxpr, Target milkv_duos:nsh
cat <
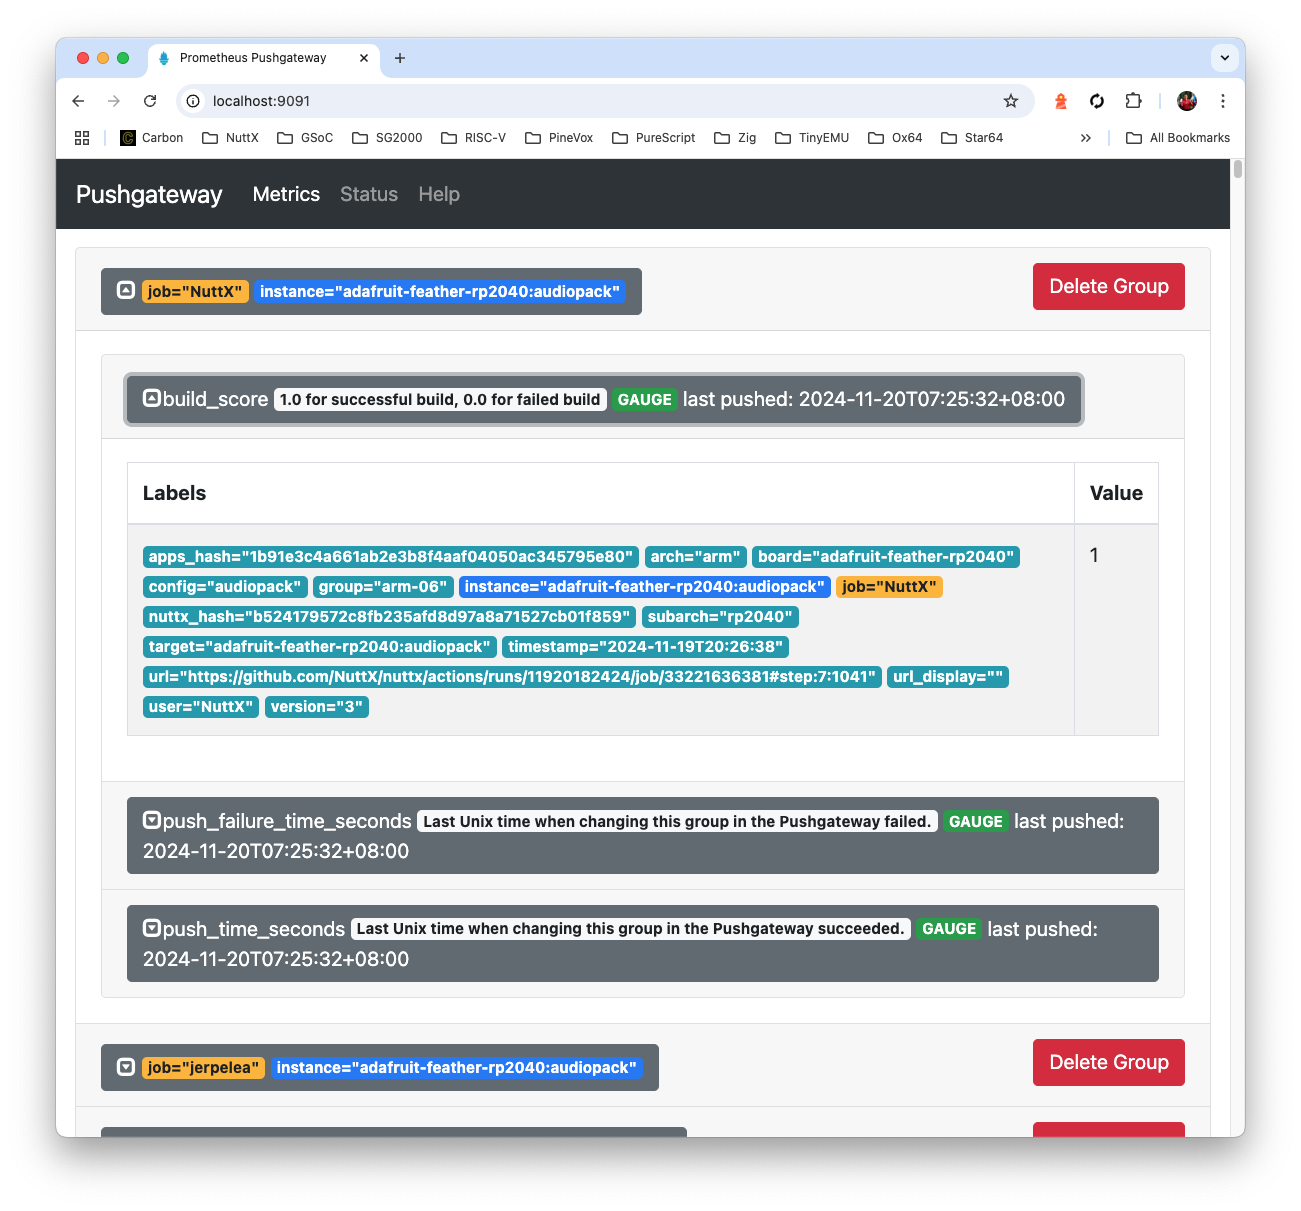
Pushgateway looks like this…
What’s this Pushgateway?
Prometheus works by Scraping Metrics over HTTP.
That’s why we install Pushgateway as a HTTP Endpoint (Staging Area) that will serve the Build Score (Metrics) to Prometheus.
(Which means that we load the Build Scores into Pushgateway, like above)
How does it work?
We post the Build Score over HTTP to Pushgateway at…
localhost:9091/metrics/job/nuttxpr/instance/milkv_duos:nsh
The Body of the HTTP POST says…
build_score{ timestamp="2024-11-24T00:00:00", url="http://gist.github.com/...", msg="test_pipe FAILED" } 0.0
-
gist.github.com points to the Build Log for the NuttX Target (GitHub Gist)
-
“test_pipe FAILED” says why the NuttX Build failed (due to CI Test)
-
0.0 is the Build Score (0 means Error)
Remember that this Build Score (0.0) is specific to our Build PC (nuttxpr) and NuttX Target (milkv_duos:nsh).
(It will vary over time, hence it’s a Time Series)
What about the other fields?
Oh yes we have a long list of fields describing Every Build Score…
| Field | Value |
|---|---|
| version | Always 3 |
| user | Which Build PC (nuttxmacos) |
| arch | Architecture (risc-v) |
| group | Target Group (risc-v-01) |
| board | Board (ox64) |
| config | Config (nsh) |
| target | Board:Config (ox64:nsh) |
| subarch | Sub-Architecture (bl808) |
| url_display | Short URL of Build Log |
| nuttx_hash | Commit Hash of NuttX Repo (7f84a64109f94787d92c2f44465e43fde6f3d28f) |
| apps_hash | Commit Hash of NuttX Apps (d6edbd0cec72cb44ceb9d0f5b932cbd7a2b96288) |
Plus the earlier fields: timestamp, url, msg. Commit Hash is super helpful for tracking a Breaking Commit!
Anything else we should know about Prometheus?
We configured Prometheus to scrape the Build Scores from Pushgateway, every 15 seconds: prometheus.yml
## Prometheus Configuration
global:
  scrape_interval: 15s

scrape_configs:
  - job_name: "prometheus"
    static_configs:
    - targets: ["localhost:9090"]

  ## Prometheus will scrape the Metrics
  ## from Pushgateway every 15 seconds
  - job_name: "pushgateway"
    static_configs:
    - targets: ["localhost:9091"]
And it’s perfectly OK to post the Same Build Log twice to Pushgateway. (Because the Timestamp will differentiate the logs)
(Ask your Local Library for “Mastering Prometheus”)
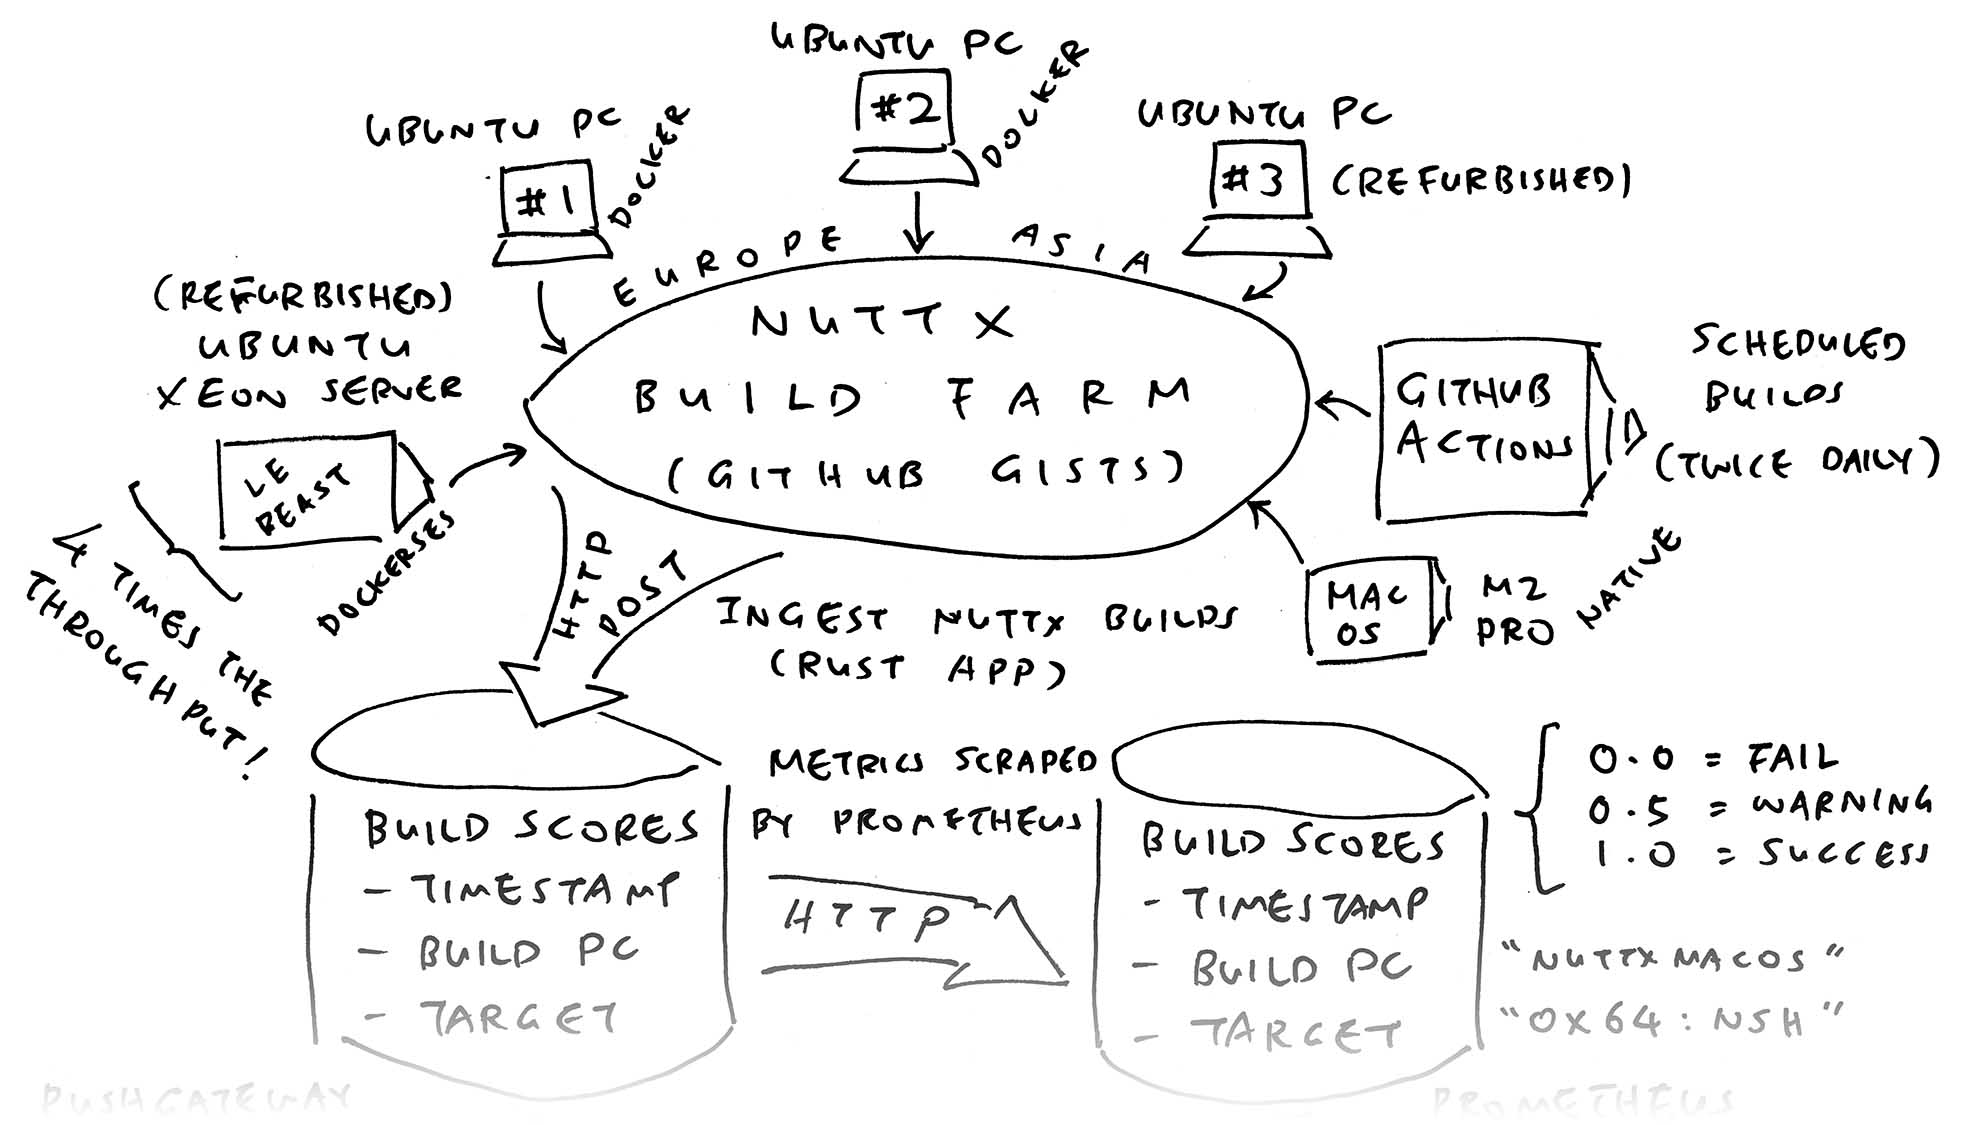
Now we be like an Amoeba and ingest all kinds of Build Logs!
For NuttX Build Farm, we ingest the GitHub Gists that contain the Build Logs: run.sh
## Find all defconfig pathnames in NuttX Repo
git clone https://github.com/apache/nuttx
find nuttx \
  -name defconfig \
  >/tmp/defconfig.txt

## Ingest the Build Logs from GitHub Gists: `nuttxpr`
## Remove special characters so they don't mess up the terminal.
git clone https://github.com/lupyuen/ingest-nuttx-builds
cd ingest-nuttx-builds
cargo run -- \
  --user nuttxpr \
  --defconfig /tmp/defconfig.txt \
  | tr -d '\033\007'
Which will Identify Errors and Warnings in the logs: main.rs
if
line.starts_with("-- ") || line.starts_with("----------") ||
line.starts_with("Cleaning") ||
line.starts_with("Configuring") ||
line.starts_with("Select") ||
line.starts_with("Disabling") ||
line.starts_with("Enabling") ||
line.starts_with("Building") ||
line.starts_with("Normalize") ||
line.starts_with("% Total") ||
line.starts_with("Dload") ||
line.starts_with("~/apps") ||
line.starts_with("~/nuttx") ||
line.starts_with("find: 'boards/") || line.starts_with("| ^~~~~~~") || line.contains("FPU test not built") ||
line.starts_with("a nuttx-export-") || line.contains(" PASSED") || line.contains(" SKIPPED") || line.contains("On branch master") || line.contains("Your branch is up to date") || line.contains("Changes not staged for commit") || line.contains("git add " ) || line.contains("git restore " ) { continue; }
let re = Regex::new(r#"^[0-9]+\s+[0-9]+"#).unwrap();
let caps = re.captures(line);
if caps.is_some() { continue; }Then compute the Build Score: main.rs
let msg_join = msg.join(" ");
let contains_error = msg_join
  .replace("aio_error", "aio_e_r_r_o_r")
  .replace("errors.lua", "e_r_r_o_r_s.lua")
  .replace("_error", "_e_r_r_o_r")
  .replace("error_", "e_r_r_o_r_")
  .to_lowercase()
  .contains("error");

let contains_error = contains_error ||
  msg_join.contains(" FAILED");

let target_split = target.split(":").collect::_>>();
let board = target_split[0];
let config = target_split[1];
let board_config = format!("/{board}/configs/{config}/defconfig");
let contains_error = contains_error ||
(
  msg_join.contains(&"modified:") &&
  msg_join.contains(&"boards/") &&
  msg_join.contains(&board_config.as_str())
);

let contains_warning = msg_join
  .to_lowercase()
  .contains("warning");

let build_score =
  if msg.is_empty() { 1.0 }
  else if contains_error { 0.0 }
  else if contains_warning { 0.5 }
  else { 0.8 };
And post the Build Scores to Pushgateway: main.rs
let body = format!(
r##"
build_score ... version= ...
"##);

let client = reqwest::Client::new();
let pushgateway = format!("http://localhost:9091/metrics/job/{user}/instance/{target}");
let res = client
  .post(pushgateway)
  .body(body)
  .send()
  .await?;
Why do we need the defconfigs?
## Find all defconfig pathnames in NuttX Repo
git clone https://github.com/apache/nuttx
find nuttx \
  -name defconfig \
  >/tmp/defconfig.txt

## defconfig.txt contains:
## boards/risc-v/sg2000/milkv_duos/configs/nsh/defconfig
## boards/arm/rp2040/seeed-xiao-rp2040/configs/ws2812/defconfig
## boards/xtensa/esp32/esp32-devkitc/configs/knsh/defconfig
Suppose we’re ingesting a NuttX Target milkv_duos:nsh.
To identify the Target’s Sub-Architecture (sg2000), we search for milkv_duos/…/nsh in the defconfig pathnames: main.rs
async fn get_sub_arch(defconfig: &str, target: &str) -> Resultdyn std::error::Error>> {
  let target_split = target.split(":").collect::_>>();
  let board = target_split[0];
  let config = target_split[1];

  let search = format!("/{board}/configs/{config}/defconfig");
  let input = File::open(defconfig).unwrap();
  let buffered = BufReader::new(input);
  for line in buffered.lines() {

    let line = line.unwrap();
    if let Some(pos) = line.find(&search) {
      let s = &line[0..pos];
      let slash = s.rfind("/").unwrap();
      let subarch = s[slash + 1..].to_string();
      return Ok(subarch);
    }
  }
  Ok("unknown".into())
}
Phew the Errors and Warnings are so complicated!
Yeah our Build Logs appear in all shapes and sizes. We might need to standardise the way we present the logs.
What about the Build Logs from GitHub Actions?
It gets a little more complicated, we need to download the Build Logs from GitHub Actions.
But before that, we need the GitHub Run ID to identify the Build Job: github.sh
## Fetch the Jobs for the Run ID. Get the Job ID for the Job Name.
local os=$1    ## "Linux" or "msys2"
local step=$2  ## "7" or "9"
local group=$3 ## "arm-01"
local job_name="$os ($group)"
local job_id=$(
  curl -L \
    -H "Accept: application/vnd.github+json" \
    -H "Authorization: Bearer $GITHUB_TOKEN" \
    -H "X-GitHub-Api-Version: 2022-11-28" \
    https://api.github.com/repos/$user/$repo/actions/runs/$run_id/jobs?per_page=100 \
    | jq ".jobs | map(select(.name == \"$job_name\")) | .[].id"
)
Now we can Download the Run Logs: github.sh
## Download the Run Logs from GitHub
## https://docs.github.com/en/rest/actions/workflow-runs?apiVersion=2022-11-28#download-workflow-run-logs
curl -L \
  --output /tmp/run-log.zip \
  -H "Accept: application/vnd.github+json" \
  -H "Authorization: Bearer $GITHUB_TOKEN" \
  -H "X-GitHub-Api-Version: 2022-11-28" \
  https://api.github.com/repos/$user/$repo/actions/runs/$run_id/logs
For Each Target Group: We ingest the Log File: github.sh
## For All Target Groups
## TODO: Handle macOS when the warnings have been cleaned up
for group in \
  arm-01 arm-02 arm-03 arm-04 \
  arm-05 arm-06 arm-07 arm-08 \
  arm-09 arm-10 arm-11 arm-12 \
  arm-13 arm-14 \
  risc-v-01 risc-v-02 risc-v-03 risc-v-04 \
  risc-v-05 risc-v-06 \
  sim-01 sim-02 sim-03 \
  xtensa-01 xtensa-02 \
  arm64-01 x86_64-01 other msys2
do
  ## Ingest the Log File
  if [[ "$group" == "msys2" ]]; then
    ingest_log "msys2" $msys2_step $group
  else
    ingest_log "Linux" $linux_step $group
  fi
done
Which will be ingested like this: github.sh
## Ingest the Log Files from GitHub Actions
cargo run -- \
  --user $user \
  --repo $repo \
  --defconfig $defconfig \
  --file $pathname \
  --nuttx-hash $nuttx_hash \
  --apps-hash $apps_hash \
  --group $group \
  --run-id $run_id \
  --job-id $job_id \
  --step $step

## user=NuttX
## repo=nuttx
## defconfig=/tmp/defconfig.txt (from earlier)
## pathname=/tmp/ingest-nuttx-builds/ci-arm-01.log
## nuttx_hash=7f84a64109f94787d92c2f44465e43fde6f3d28f
## apps_hash=d6edbd0cec72cb44ceb9d0f5b932cbd7a2b96288
## group=arm-01
## run_id=11603561928
## job_id=32310817851
## step=7
How to run all this?
We ingest the GitHub Logs right after the Twice-Daily Build of NuttX. (00:00 UTC and 12:00 UTC)
Thus it makes sense to bundle the Build and Ingest into One Single Script: build-github-and-ingest.sh
## Build NuttX Mirror Repo and Ingest NuttX Build Logs
## from GitHub Actions into Prometheus Pushgateway

## TODO: Twice Daily at 00:00 UTC and 12:00 UTC
## Go to NuttX Mirror Repo: github.com/NuttX/nuttx
## Click Sync Fork > Discard Commits

## Start the Linux, macOS and Windows Builds for NuttX
## https://github.com/lupyuen/nuttx-release/blob/main/enable-macos-windows.sh
~/nuttx-release/enable-macos-windows.sh

## Wait for the NuttX Build to start
sleep 300

## Wait for the NuttX Build to complete
## Then ingest the GitHub Logs
## https://github.com/lupyuen/ingest-nuttx-builds/blob/main/github.sh
./github.sh
And that’s how we created our Continuous Integration Dashboard for NuttX!
(Please join our Build Farm 🙏)
Why are we doing all this?
That’s because we can’t afford to run Complete CI Checks on Every Pull Request!
We expect some breakage, and NuttX Dashboard will help with the fixing.
What happens when NuttX Dashboard reports a Broken Build?
Right now we scramble to identify the Breaking Commit. And prevent more Broken Commits from piling on.
Yes NuttX Dashboard will tell us the Commit Hashes for the Build History. But the Batched Commits aren’t Temporally Precise, and we race against time to inspect and recompile each Past Commit.
Can we automate this?
Yeah someday our NuttX Build Farm shall “Rewind The Build” when something breaks…
Automatically Backtrack the Commits, Compile each Commit and discover the Breaking Commit. (Like this)
Any more stories of NuttX CI?
Next Article: We chat about the updated NuttX Build Farm that runs on macOS for Apple Silicon. (Great news for NuttX Devs on macOS)
Then we study the internals of a Mystifying Bug that concerns PyTest, QEMU RISC-V and expect. (So it will disappear sooner from NuttX Dashboard)
Many Thanks to the awesome NuttX Admins and NuttX Devs! And my GitHub Sponsors, for sticking with me all these years.
Got a question, comment or suggestion? Create an Issue or submit a Pull Request here…
Earlier we spoke about creating the NuttX Dashboard (pic above). And we created a Rudimentary Dashboard with Grafana…
We nearly completed the Panel JSON…
Let’s flesh out the remaining bits of our creation.
Before we begin: Check that our Prometheus Data Source is configured to fetch the Build Scores from Prometheus and Pushgateway…
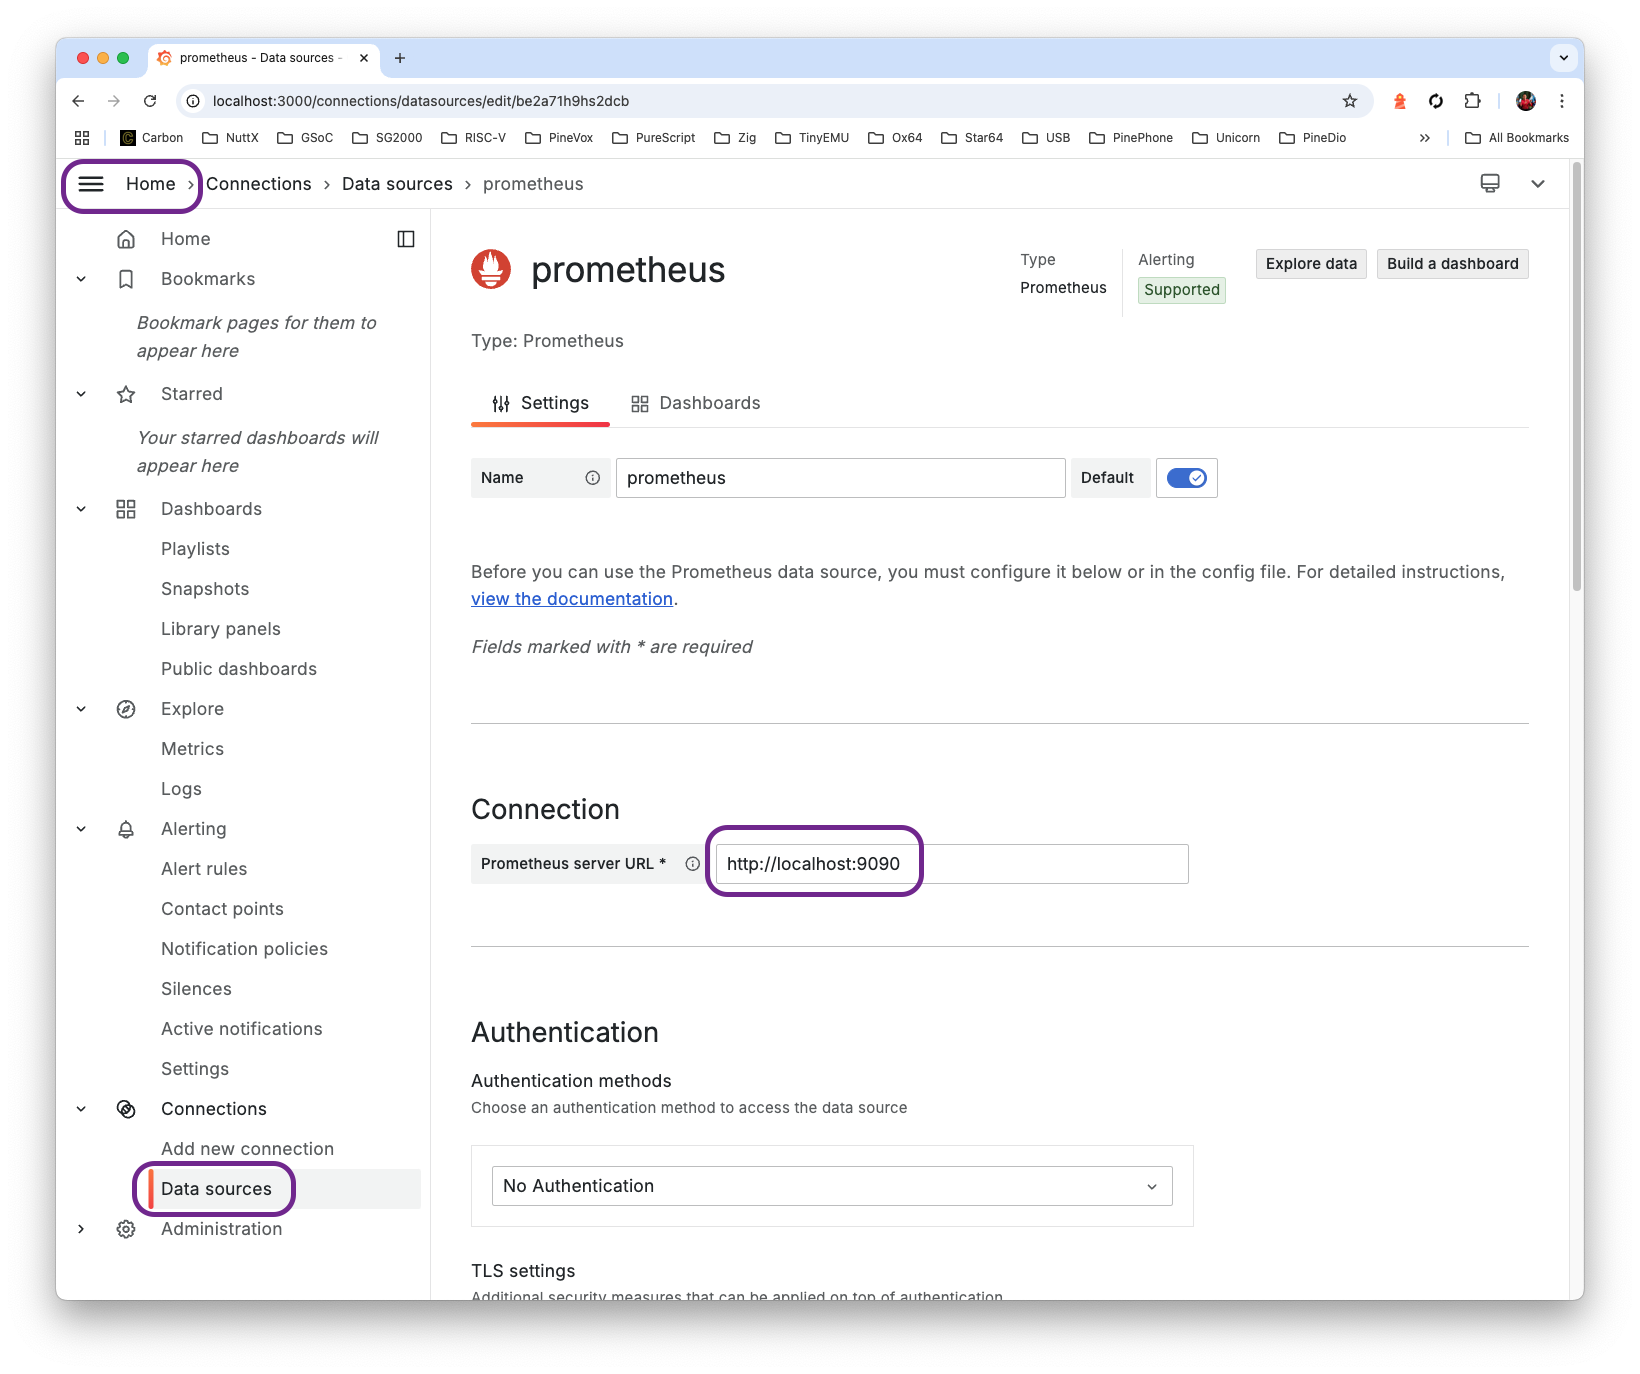
(Remember to set prometheus.yml)
Head back to our upcoming dashboard…
-
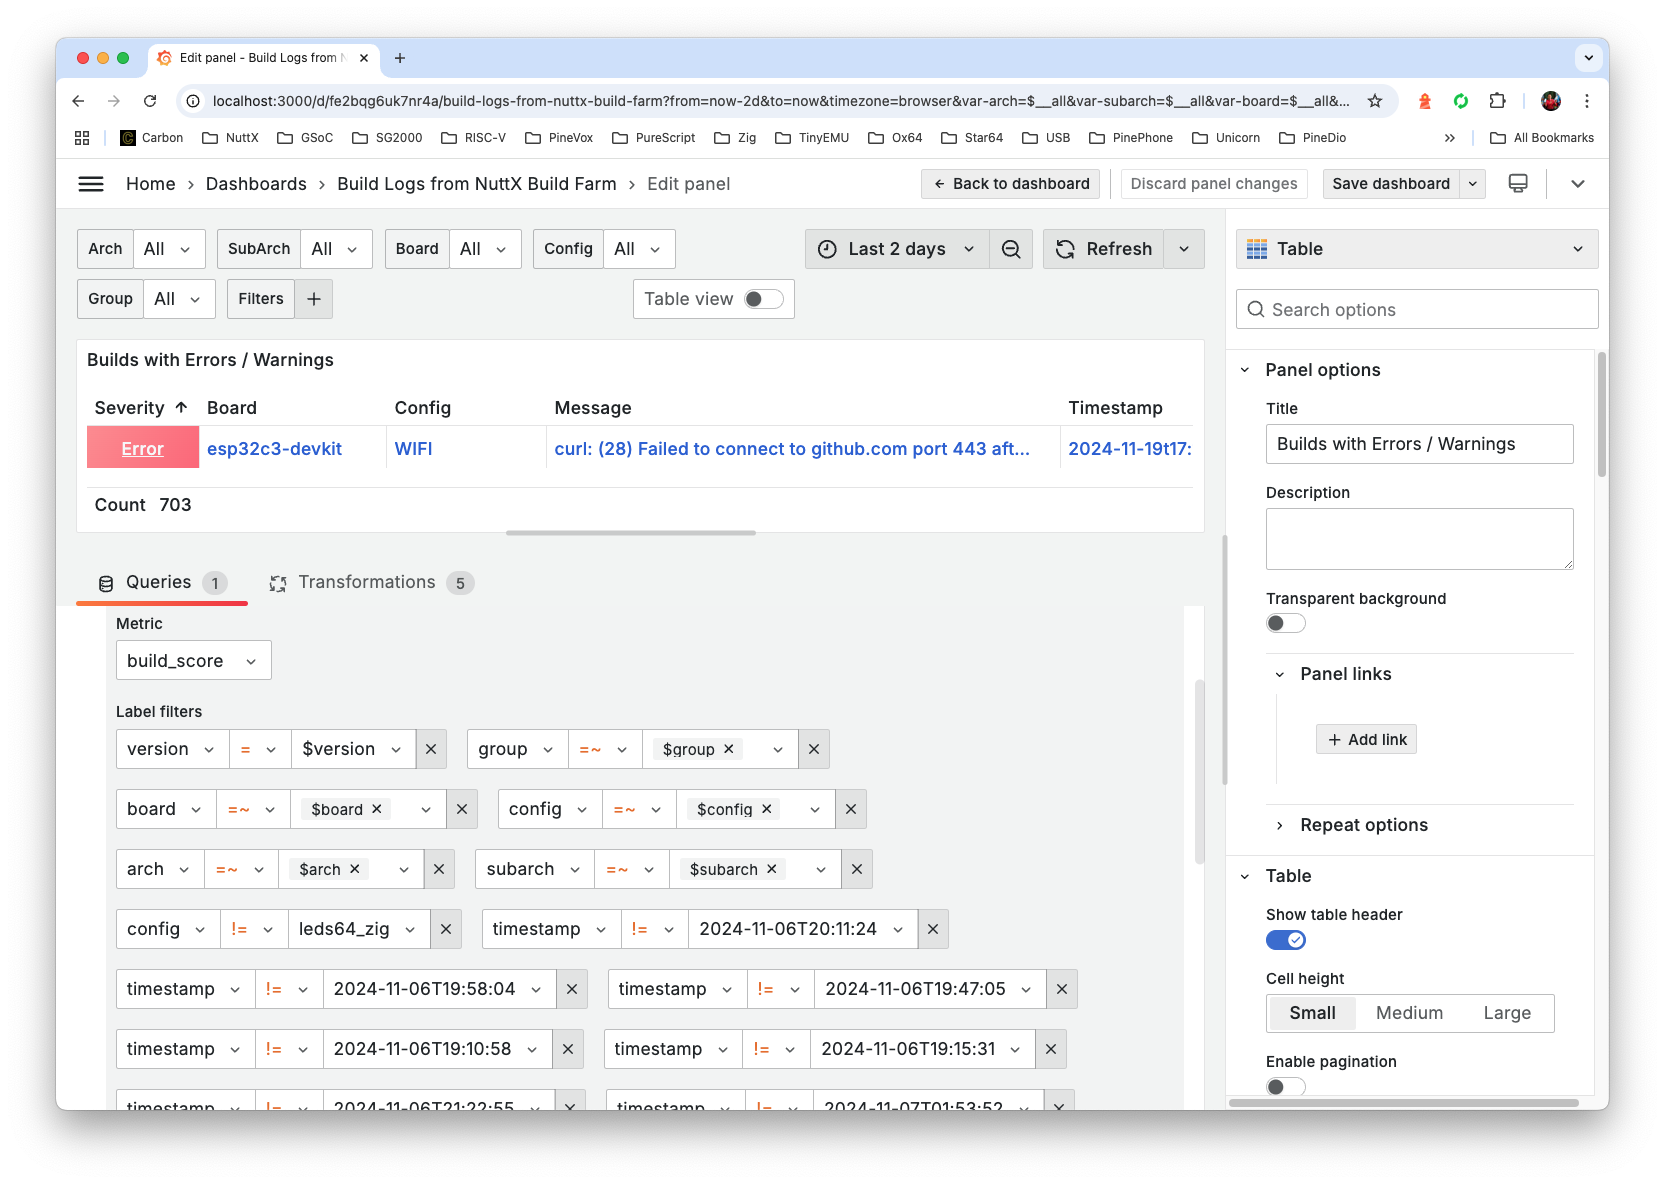
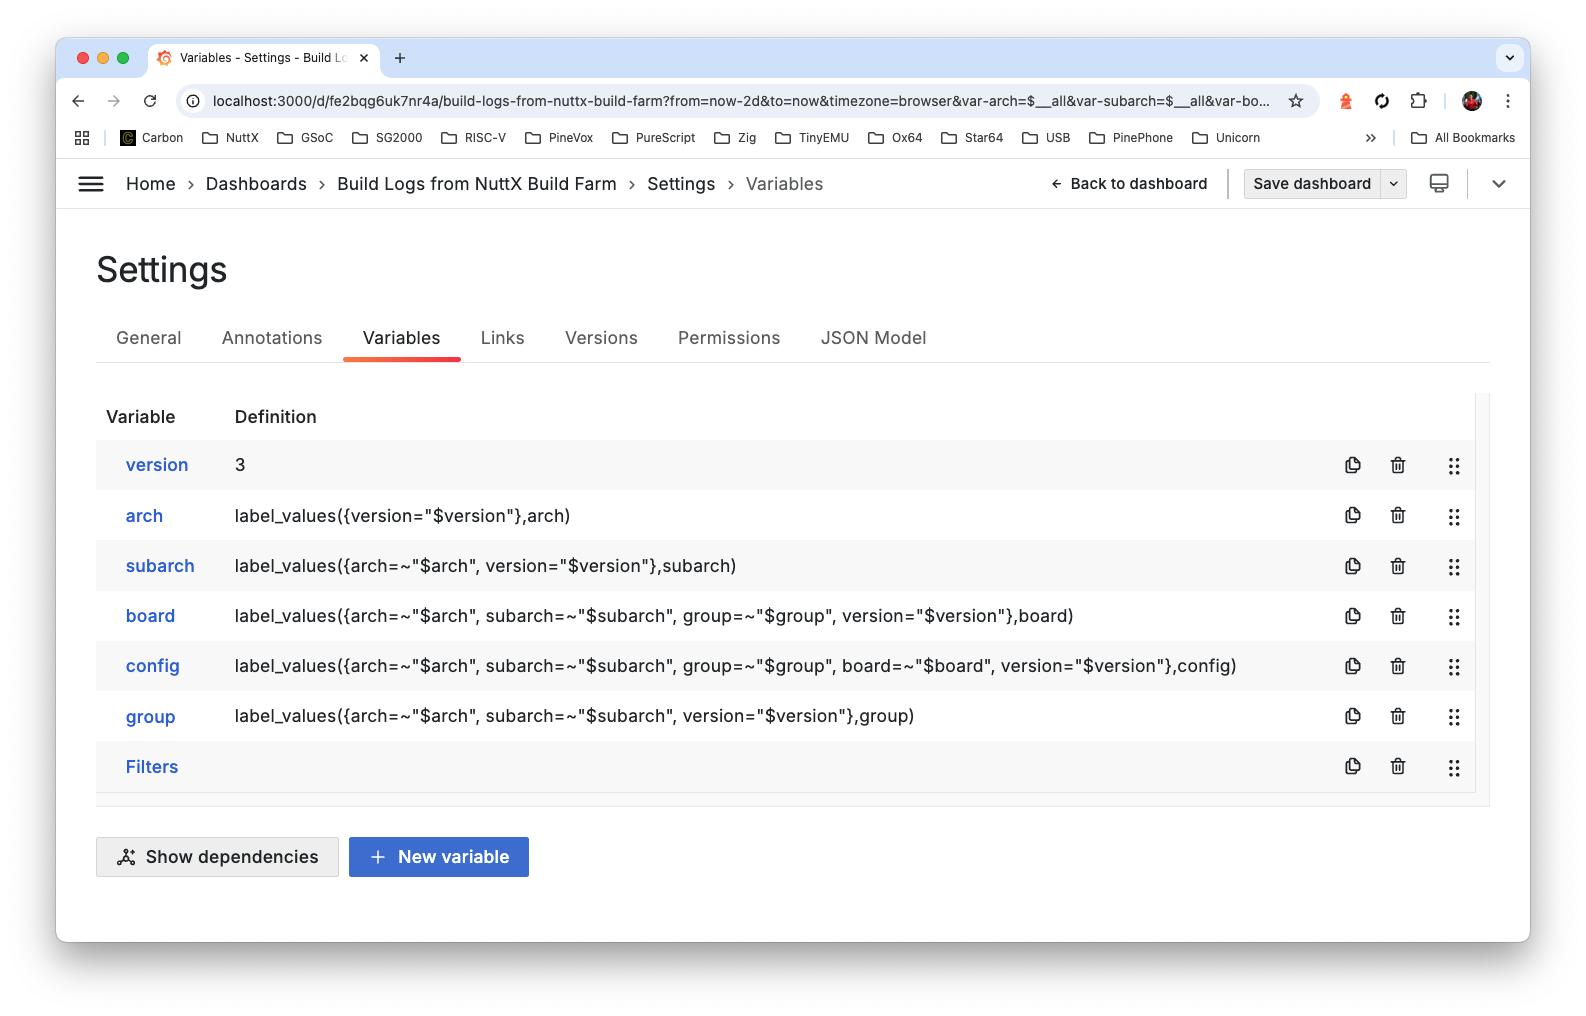
This is how we Filter by Arch, Sub-Arch, Board, Config, which we defined as Dashboard Variables (see below)
-
Why match the Funny Timestamps? Well mistakes were make. We exclude these Timestamps so they won’t appear in the dashboard…
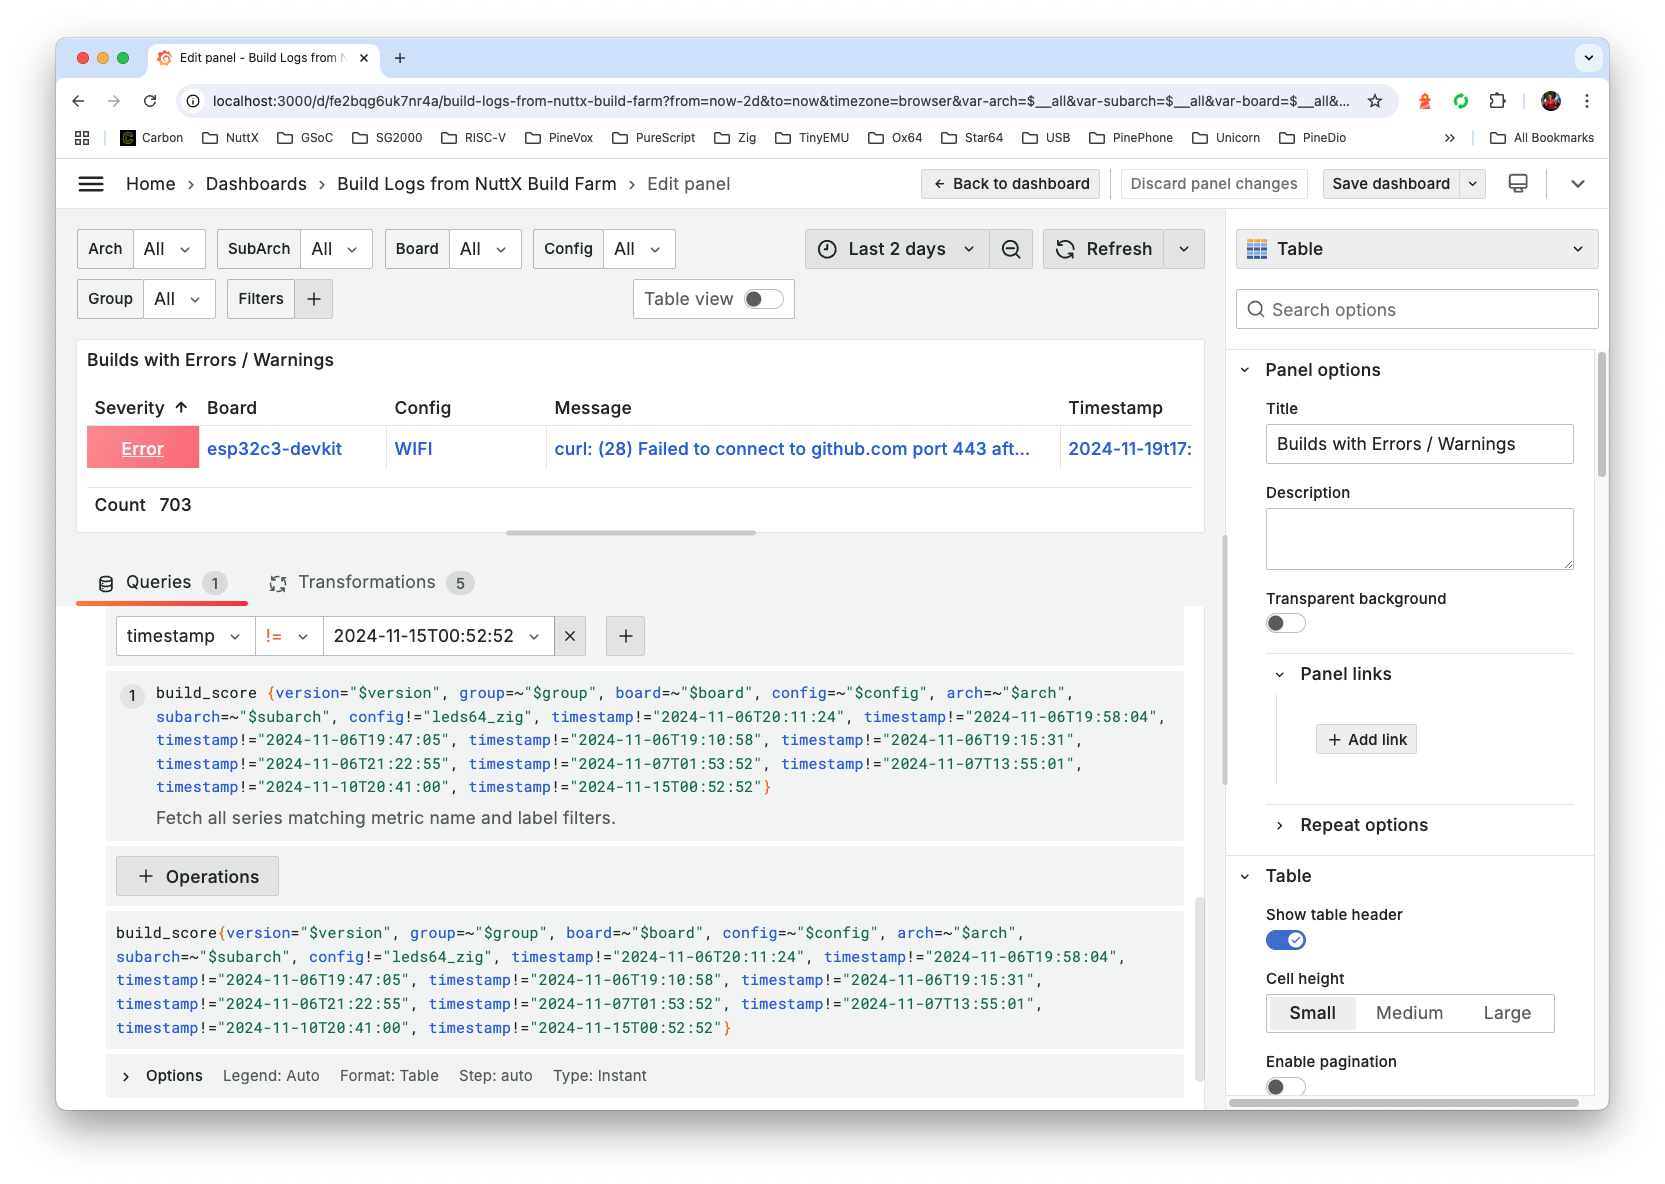
-
For Builds with Errors and Warnings: We select Values (Build Scores) <= 0.5…
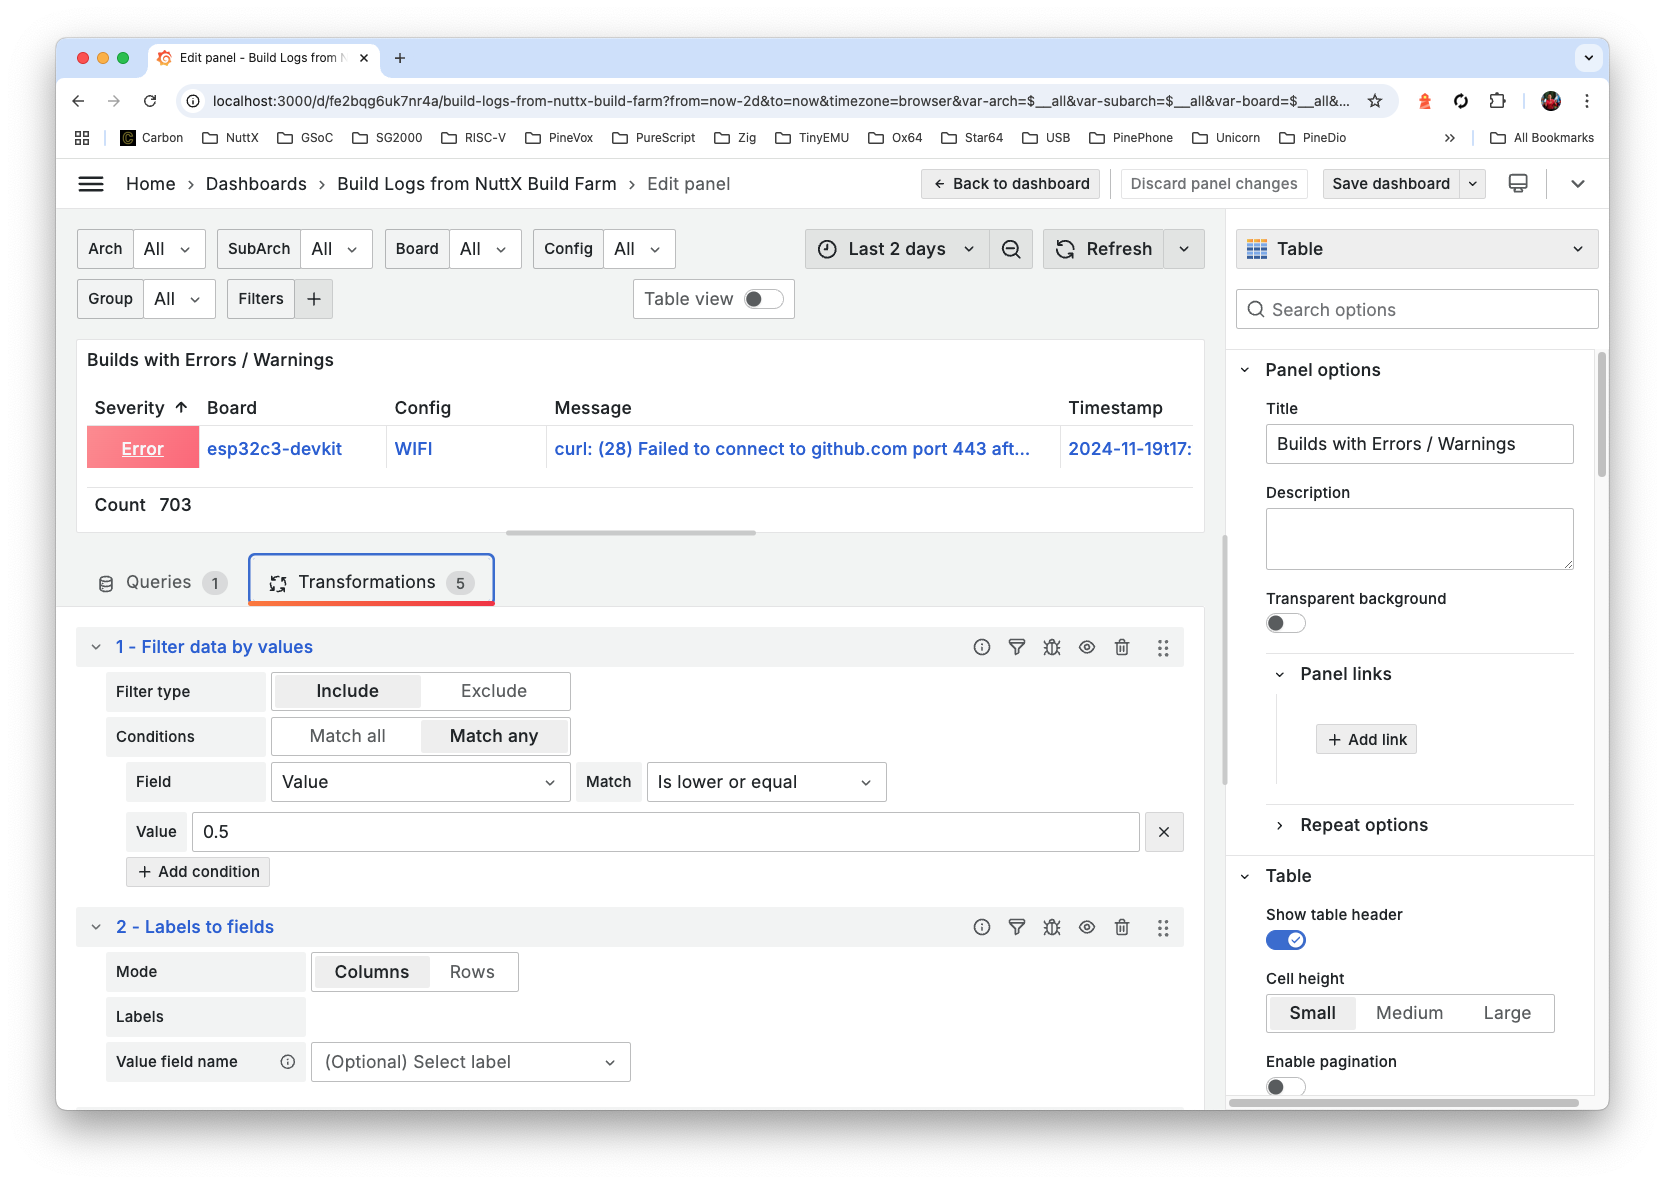
-
We Rename and Reorder the Fields…
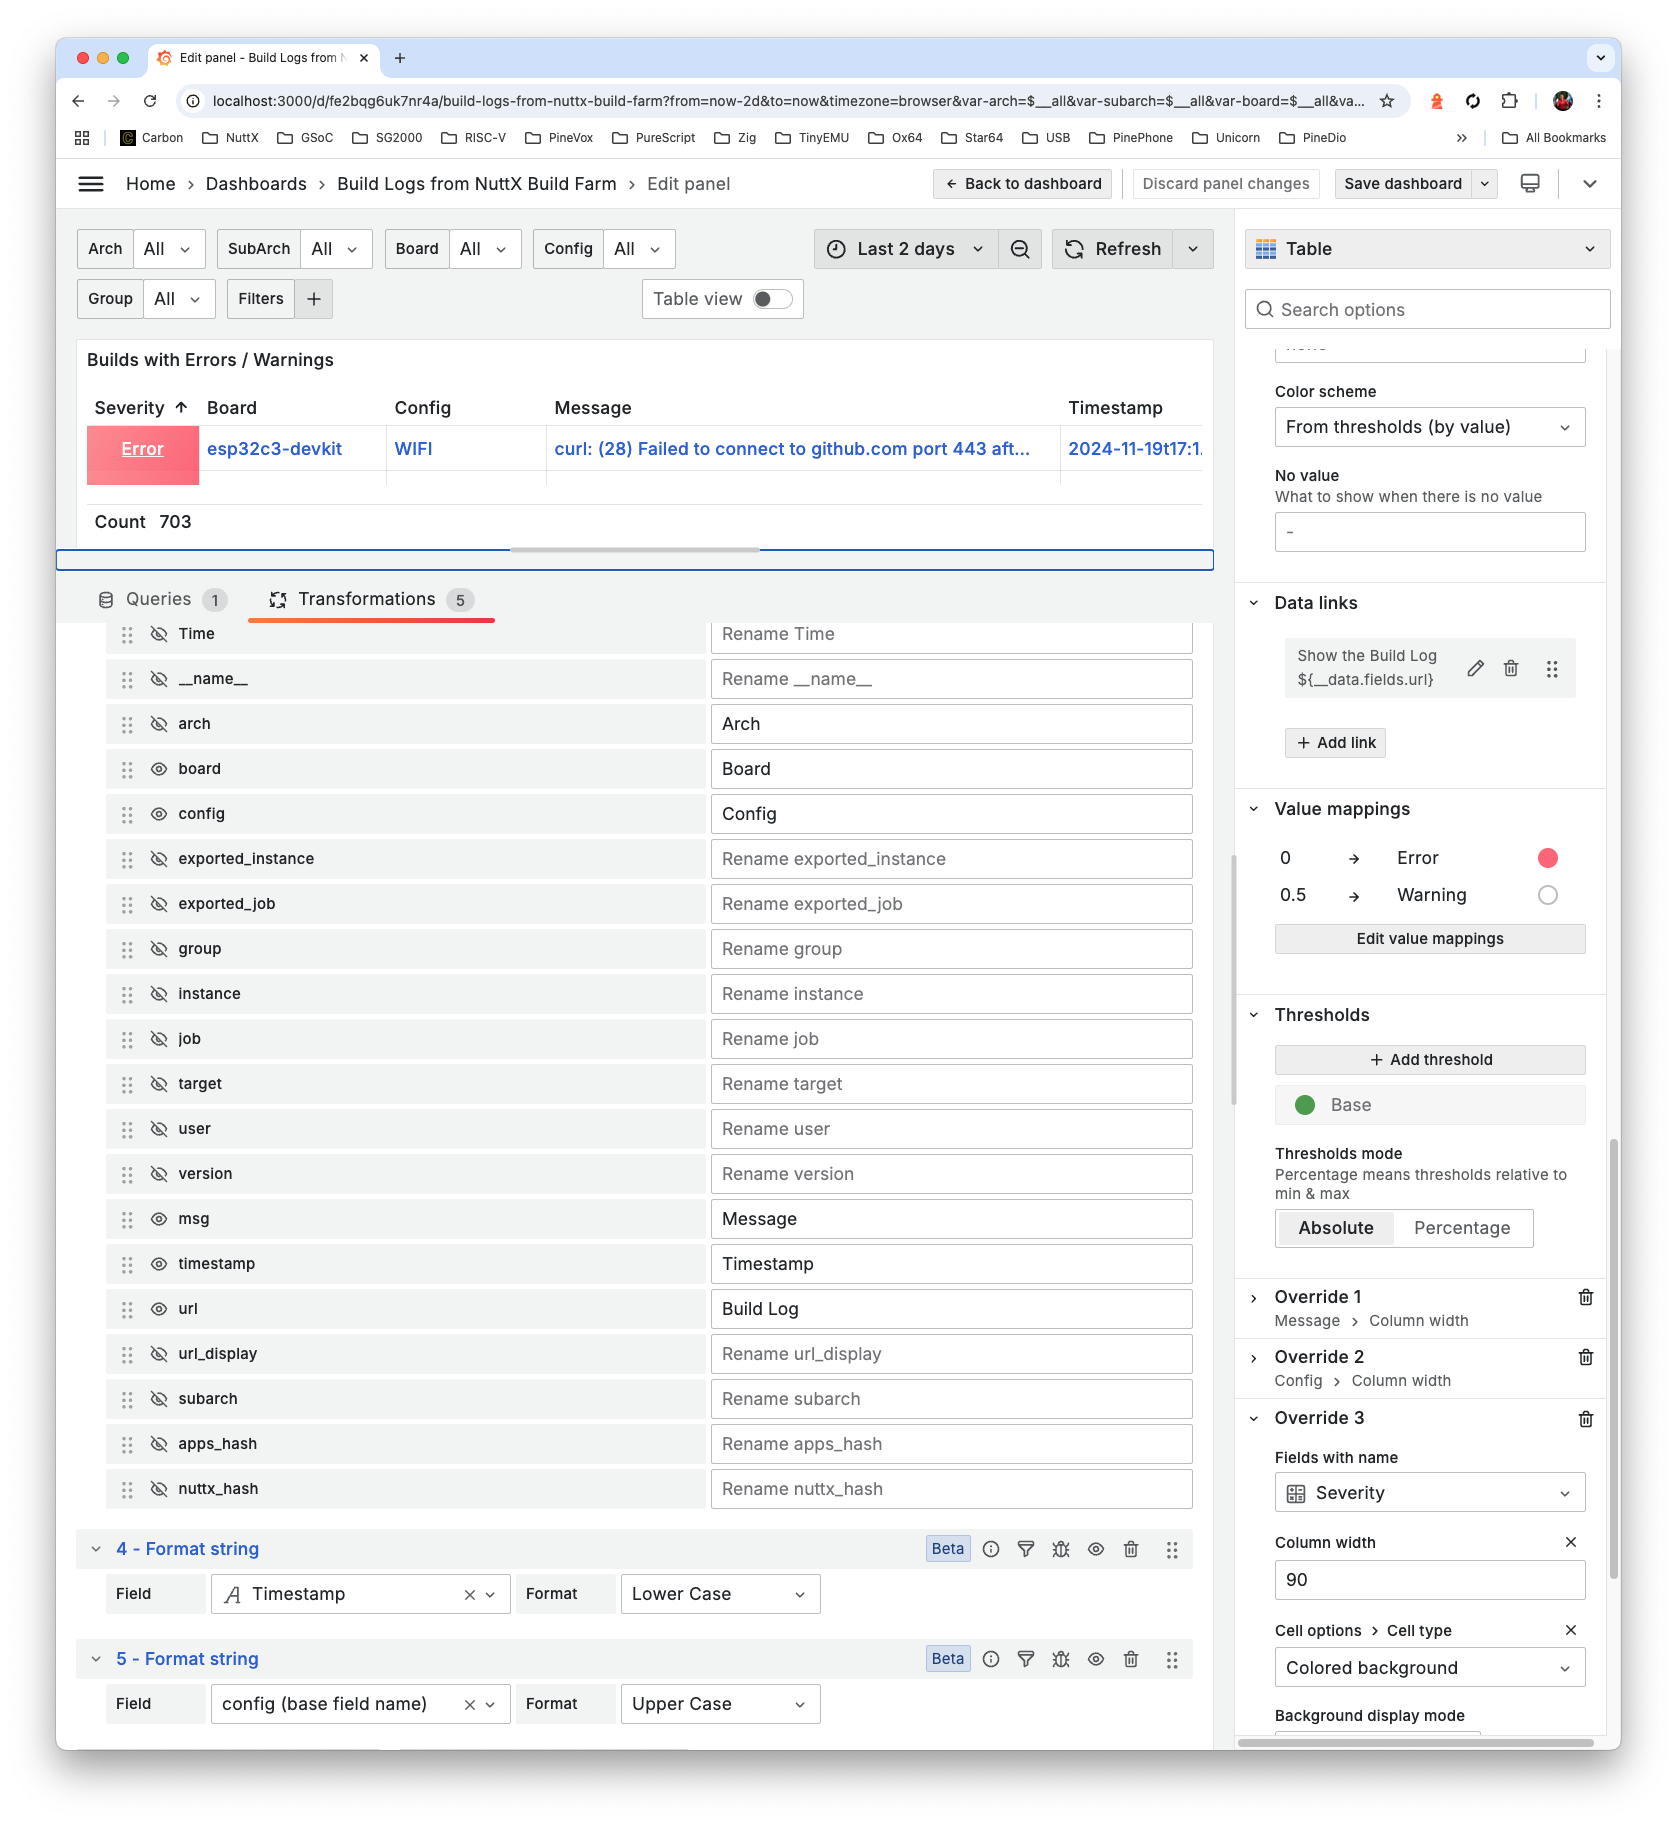
-
Set the Timestamp to Lower Case, Config to Upper Case…
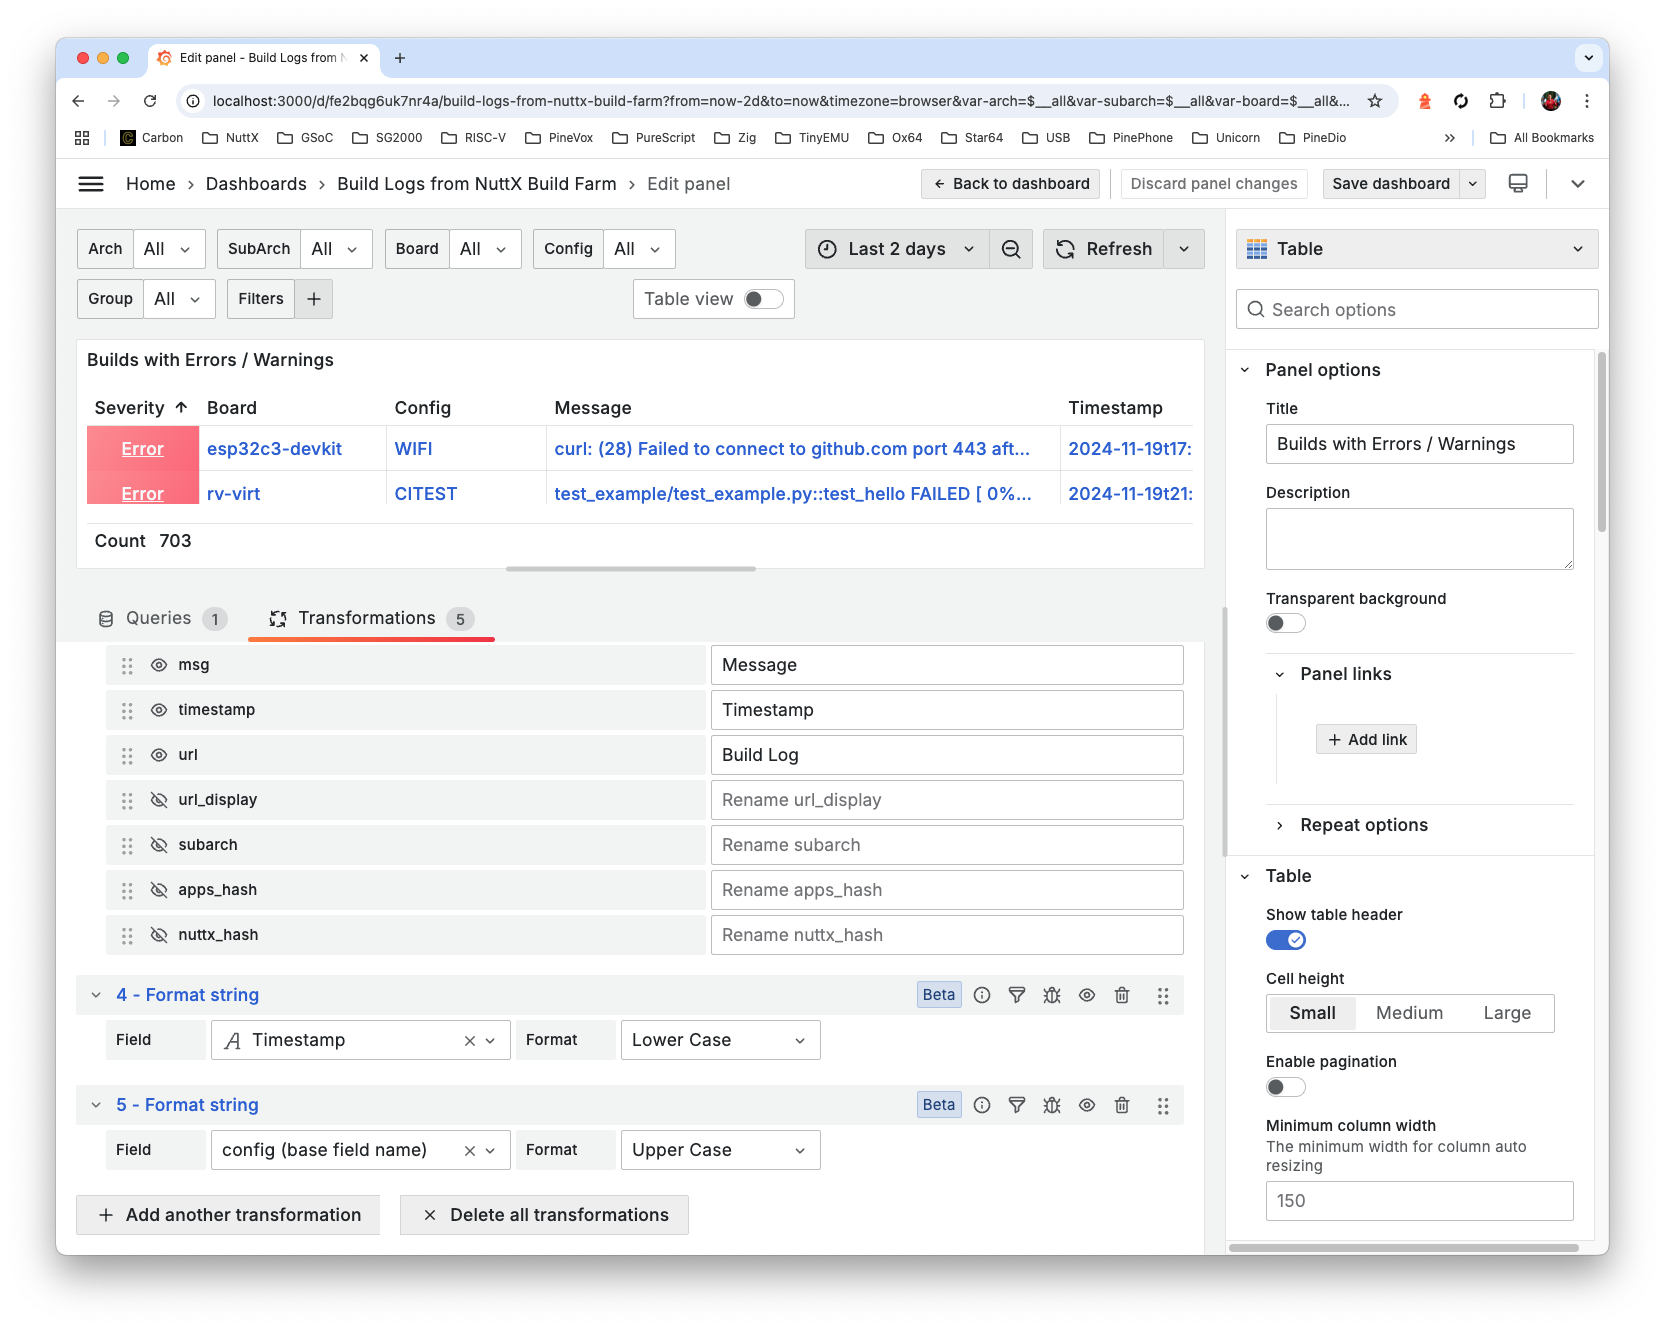
-
Set the Color Scheme to From Thresholds By Value
Set the Data Links: Title becomes “
Show the Build Log”, URL becomes “${__data.fields.url}”Colour the Values (Build Scores) with the Value Mappings below
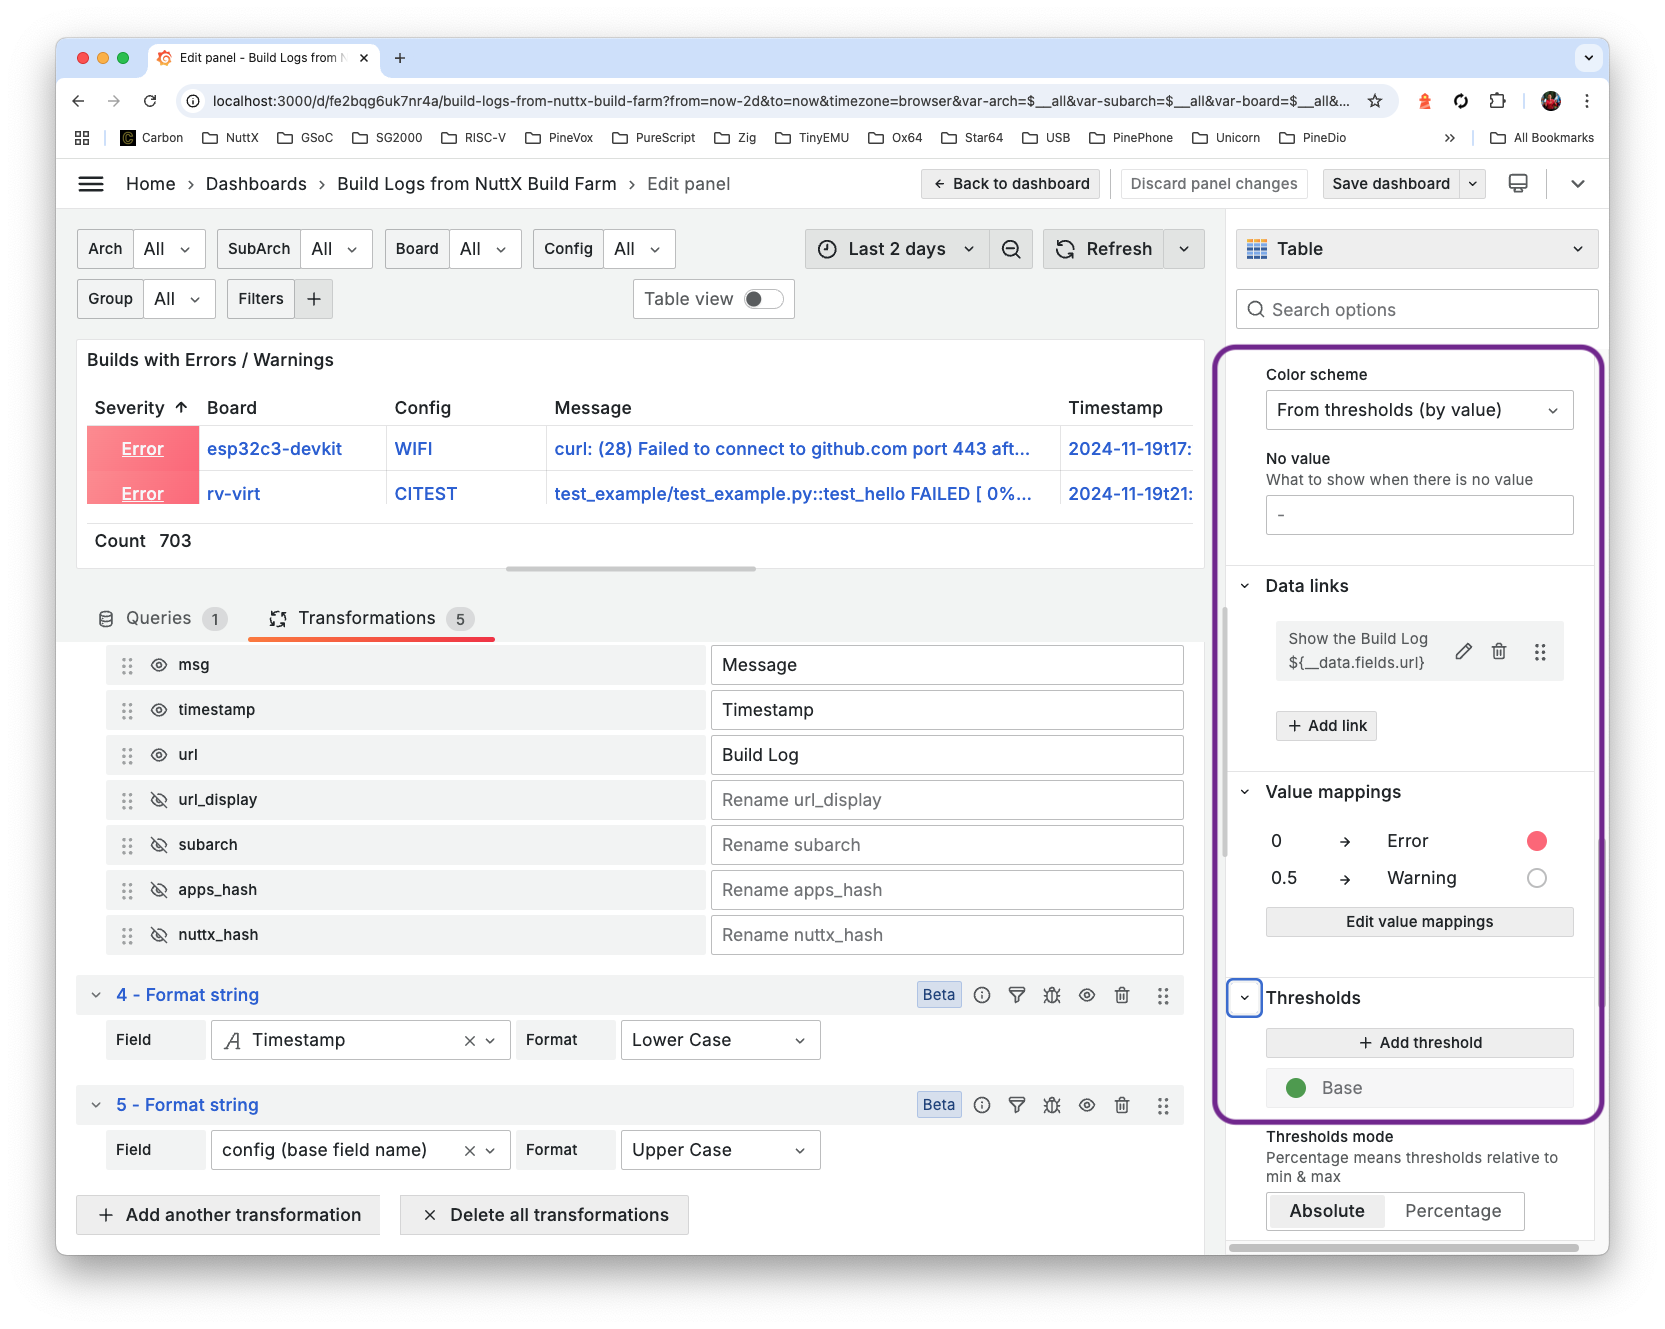
-
And we’ll achieve this Completed Panel JSON…
What about the Successful Builds?
-
Copy the Panel for “Builds with Errors and Warnings”
Paste into a New Panel: “Successful Builds”
-
Select Values (Build Scores) > 0.5
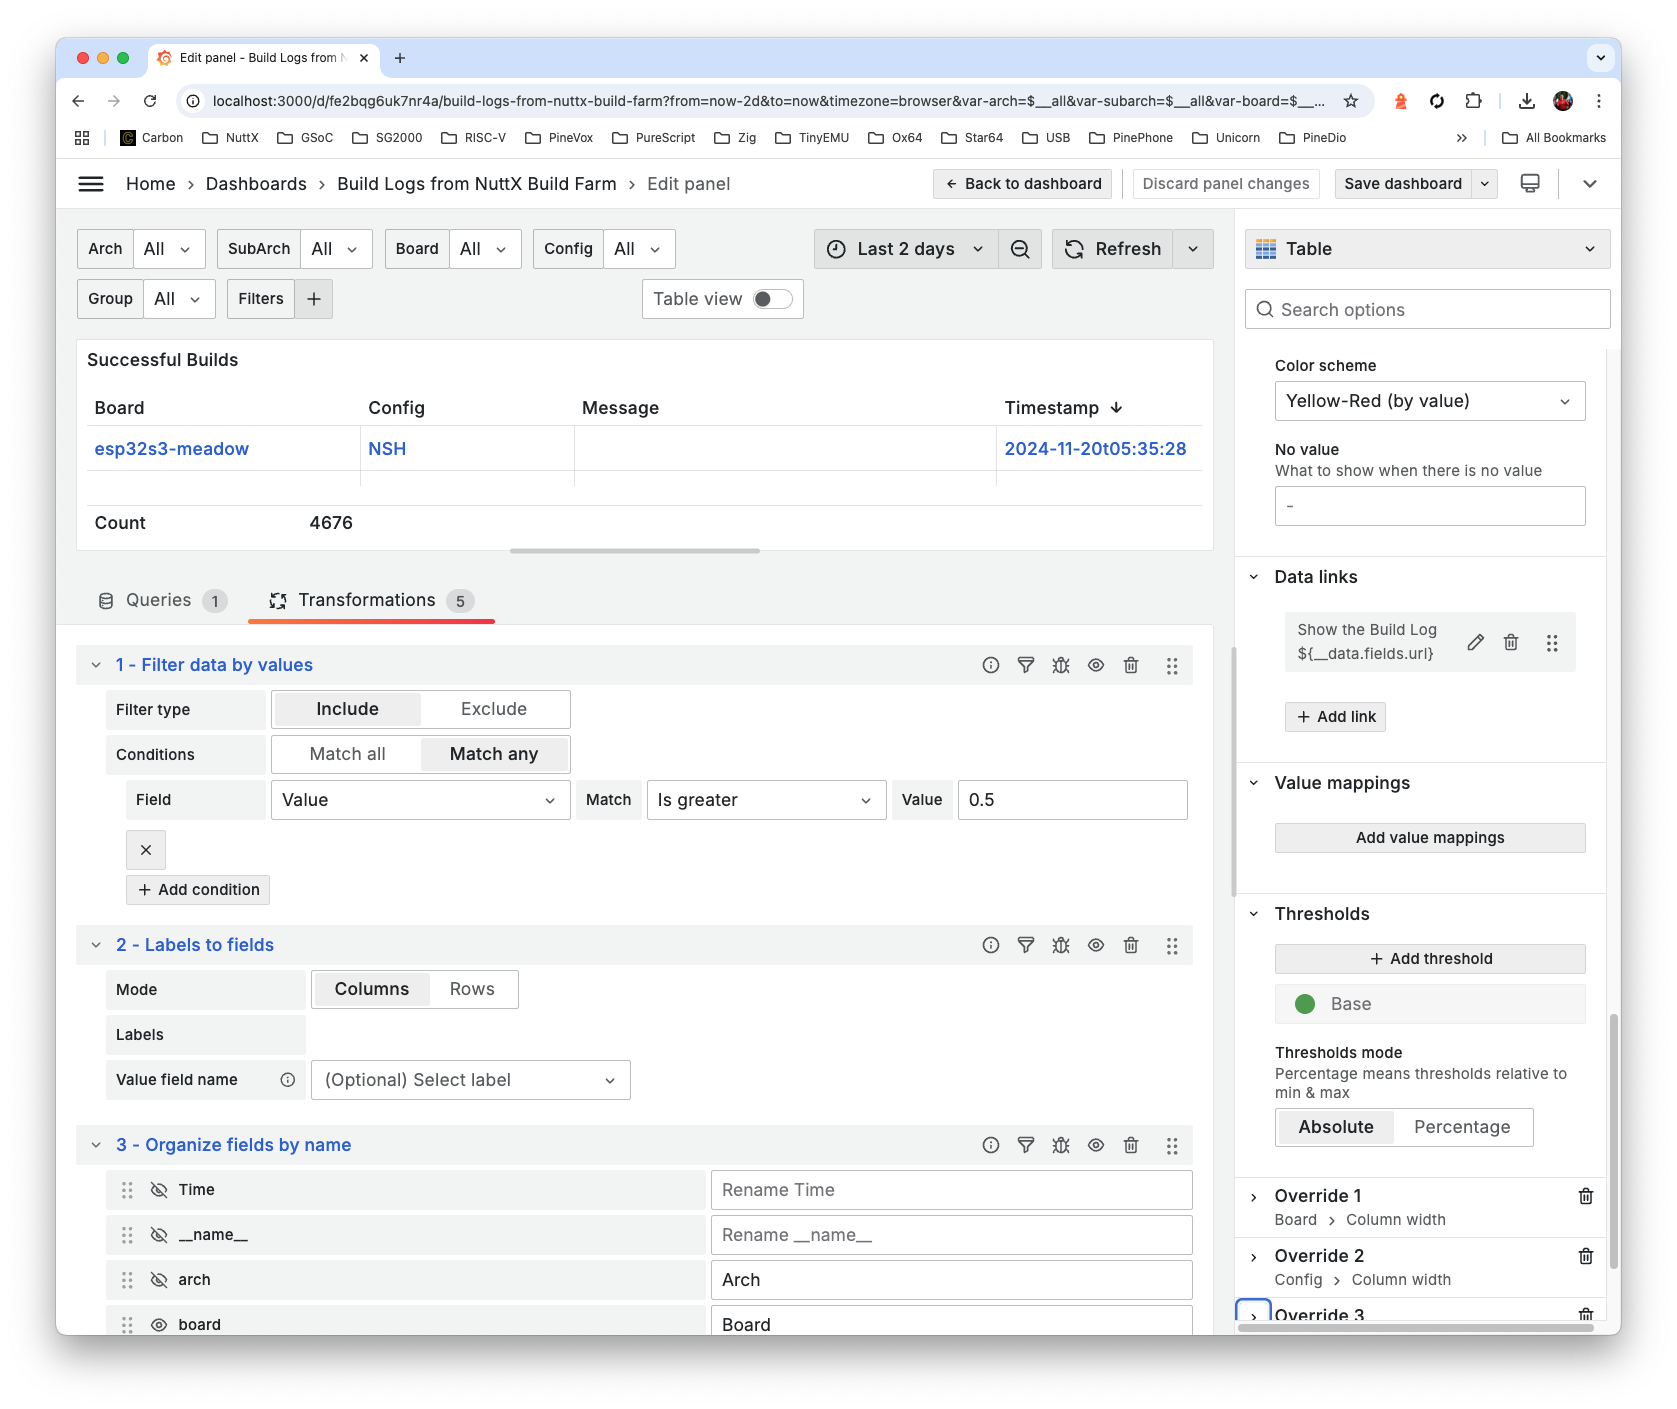
-
And we’ll accomplish this Completed Panel JSON
And the Highlights Panel at the top?
-
Copy the Panel for “Builds with Errors and Warnings”
Paste into a New Panel: “Highlights of Errors / Warnings”
-
Change the Visualisation from “Table” to “Stat” (top right)
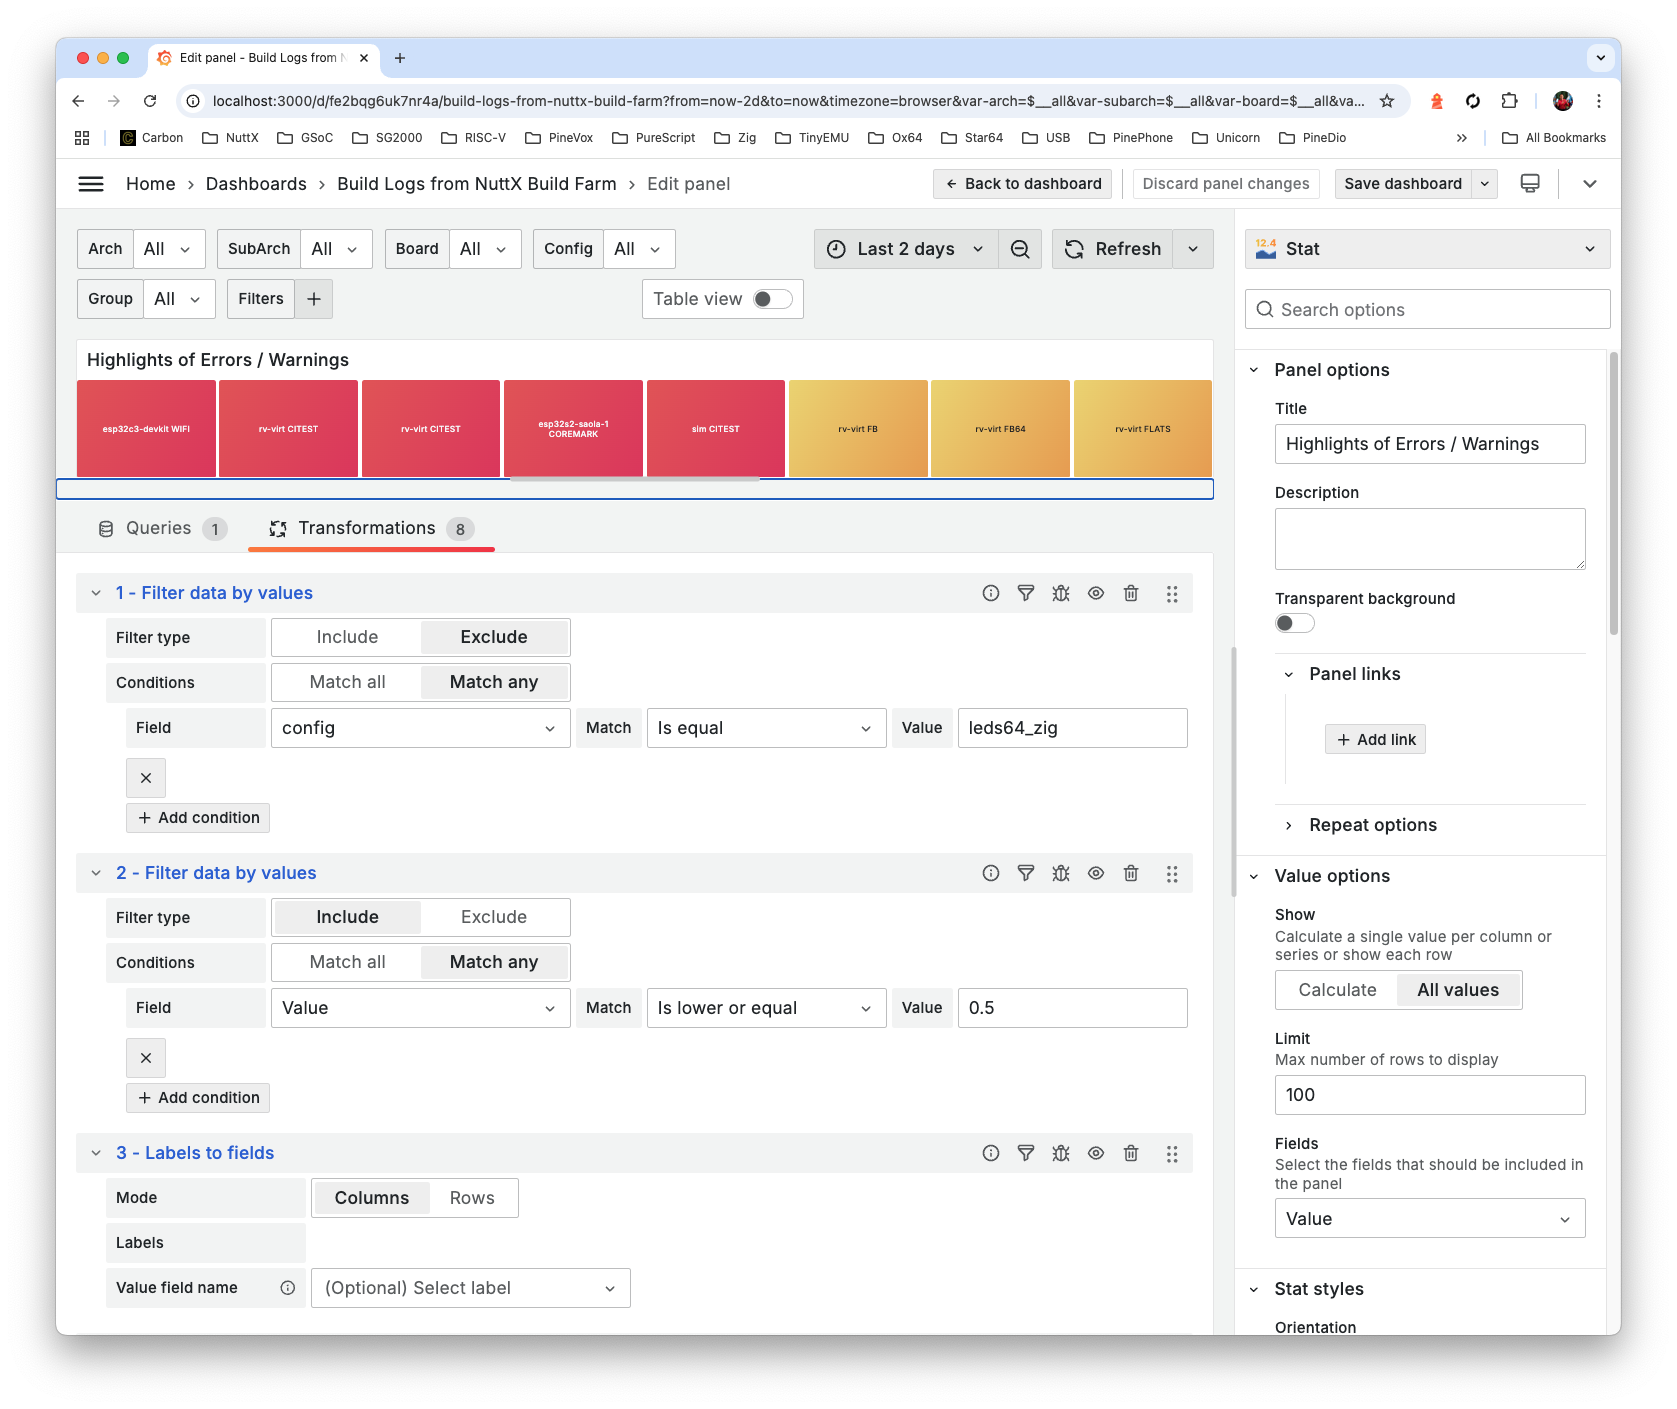
-
Select Sort by Value (Build Score) and Limit to 8 Items…
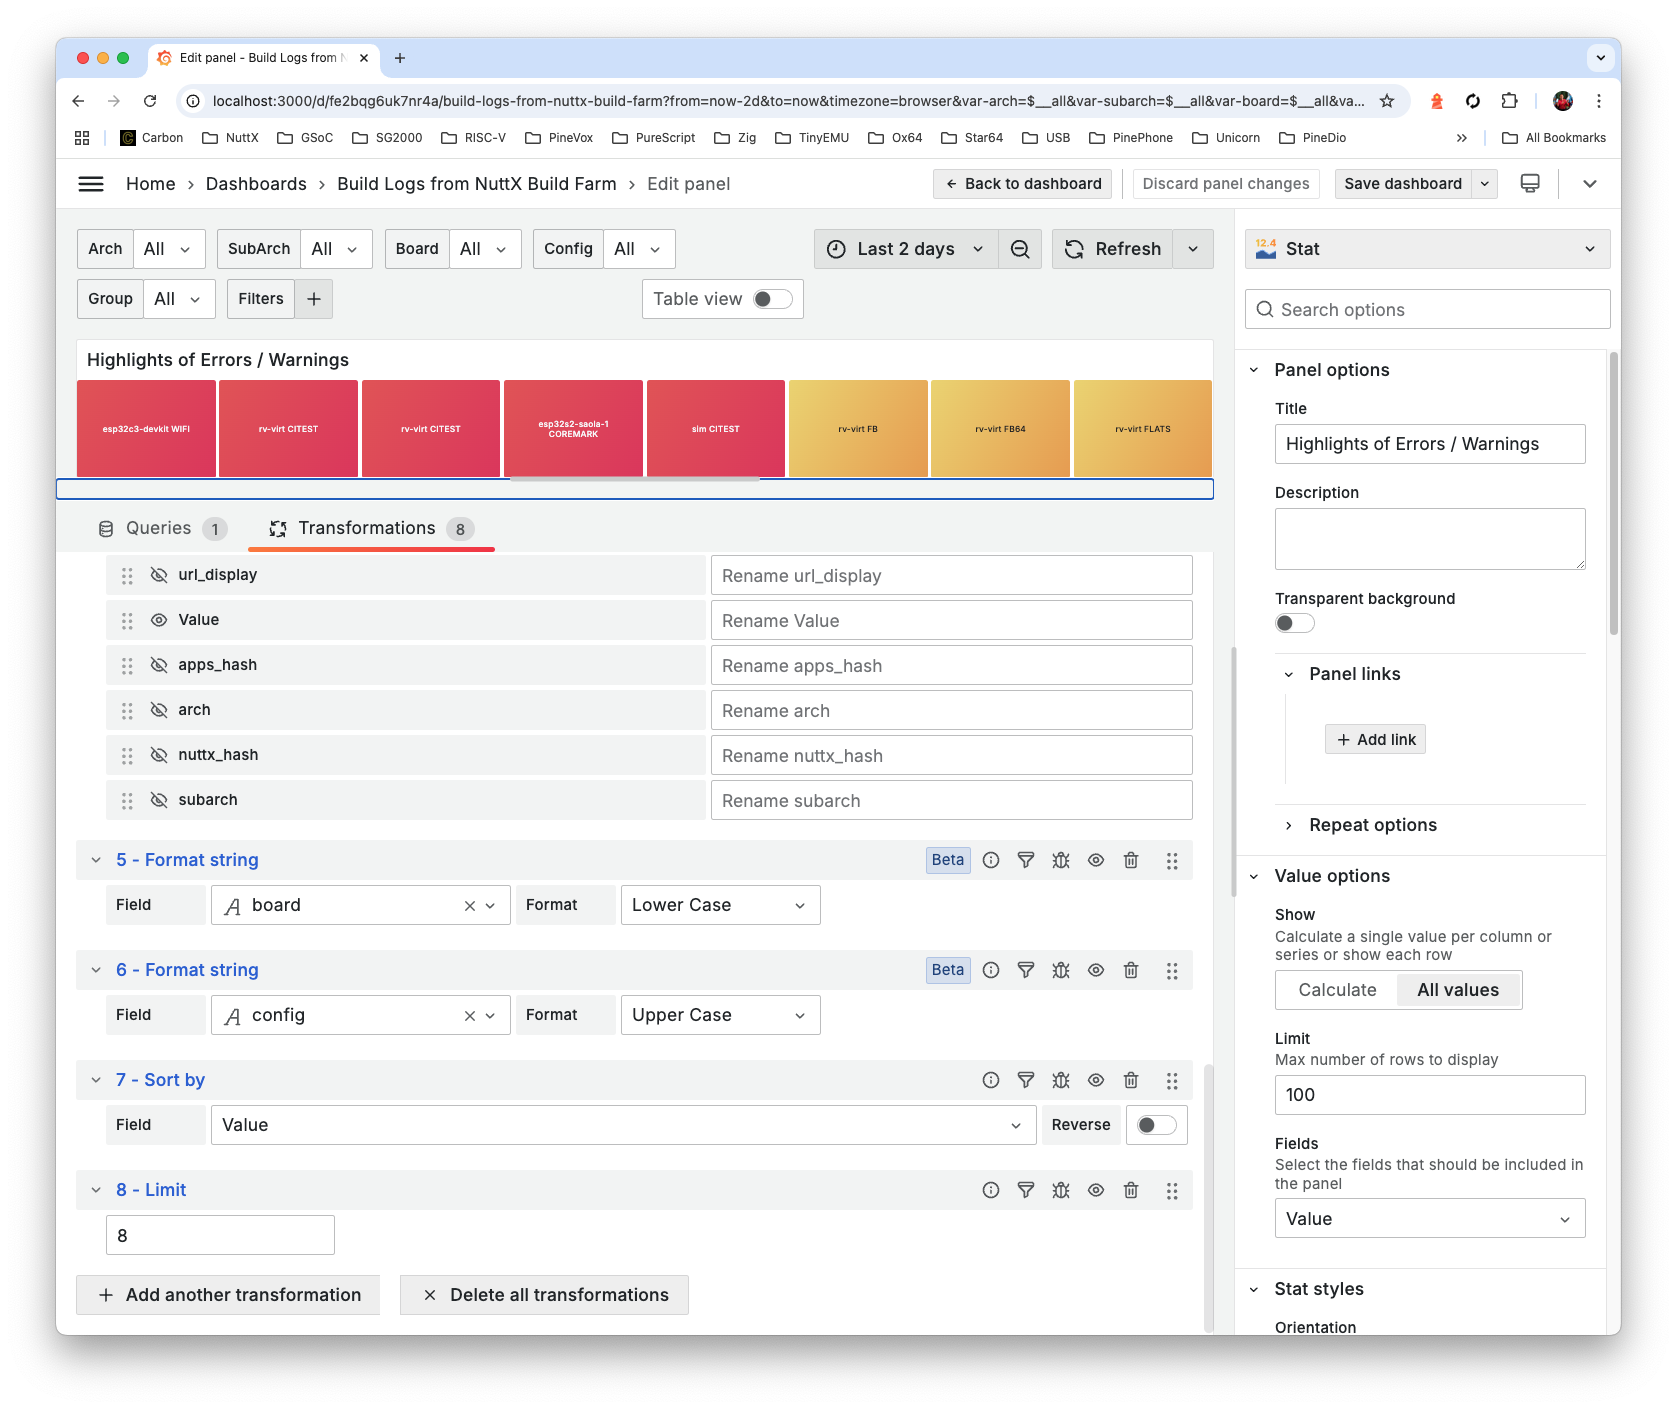
-
And we’ll get this Completed Panel JSON
-
Also check out the Dashboard JSON and Links Panel (“See the NuttX Build History”)
Which will define the Dashboard Variables…
Up Next: The NuttX Dashboard for Build History…
In the previous section: We created the NuttX Dashboard for Errors, Warnings and Successful Builds.
Now we do the same for Build History Dashboard (pic above)…
-
Copy the Dashboard from the previous section.
Delete all Panels, except “Builds with Errors and Warnings”.
Edit the Panel.
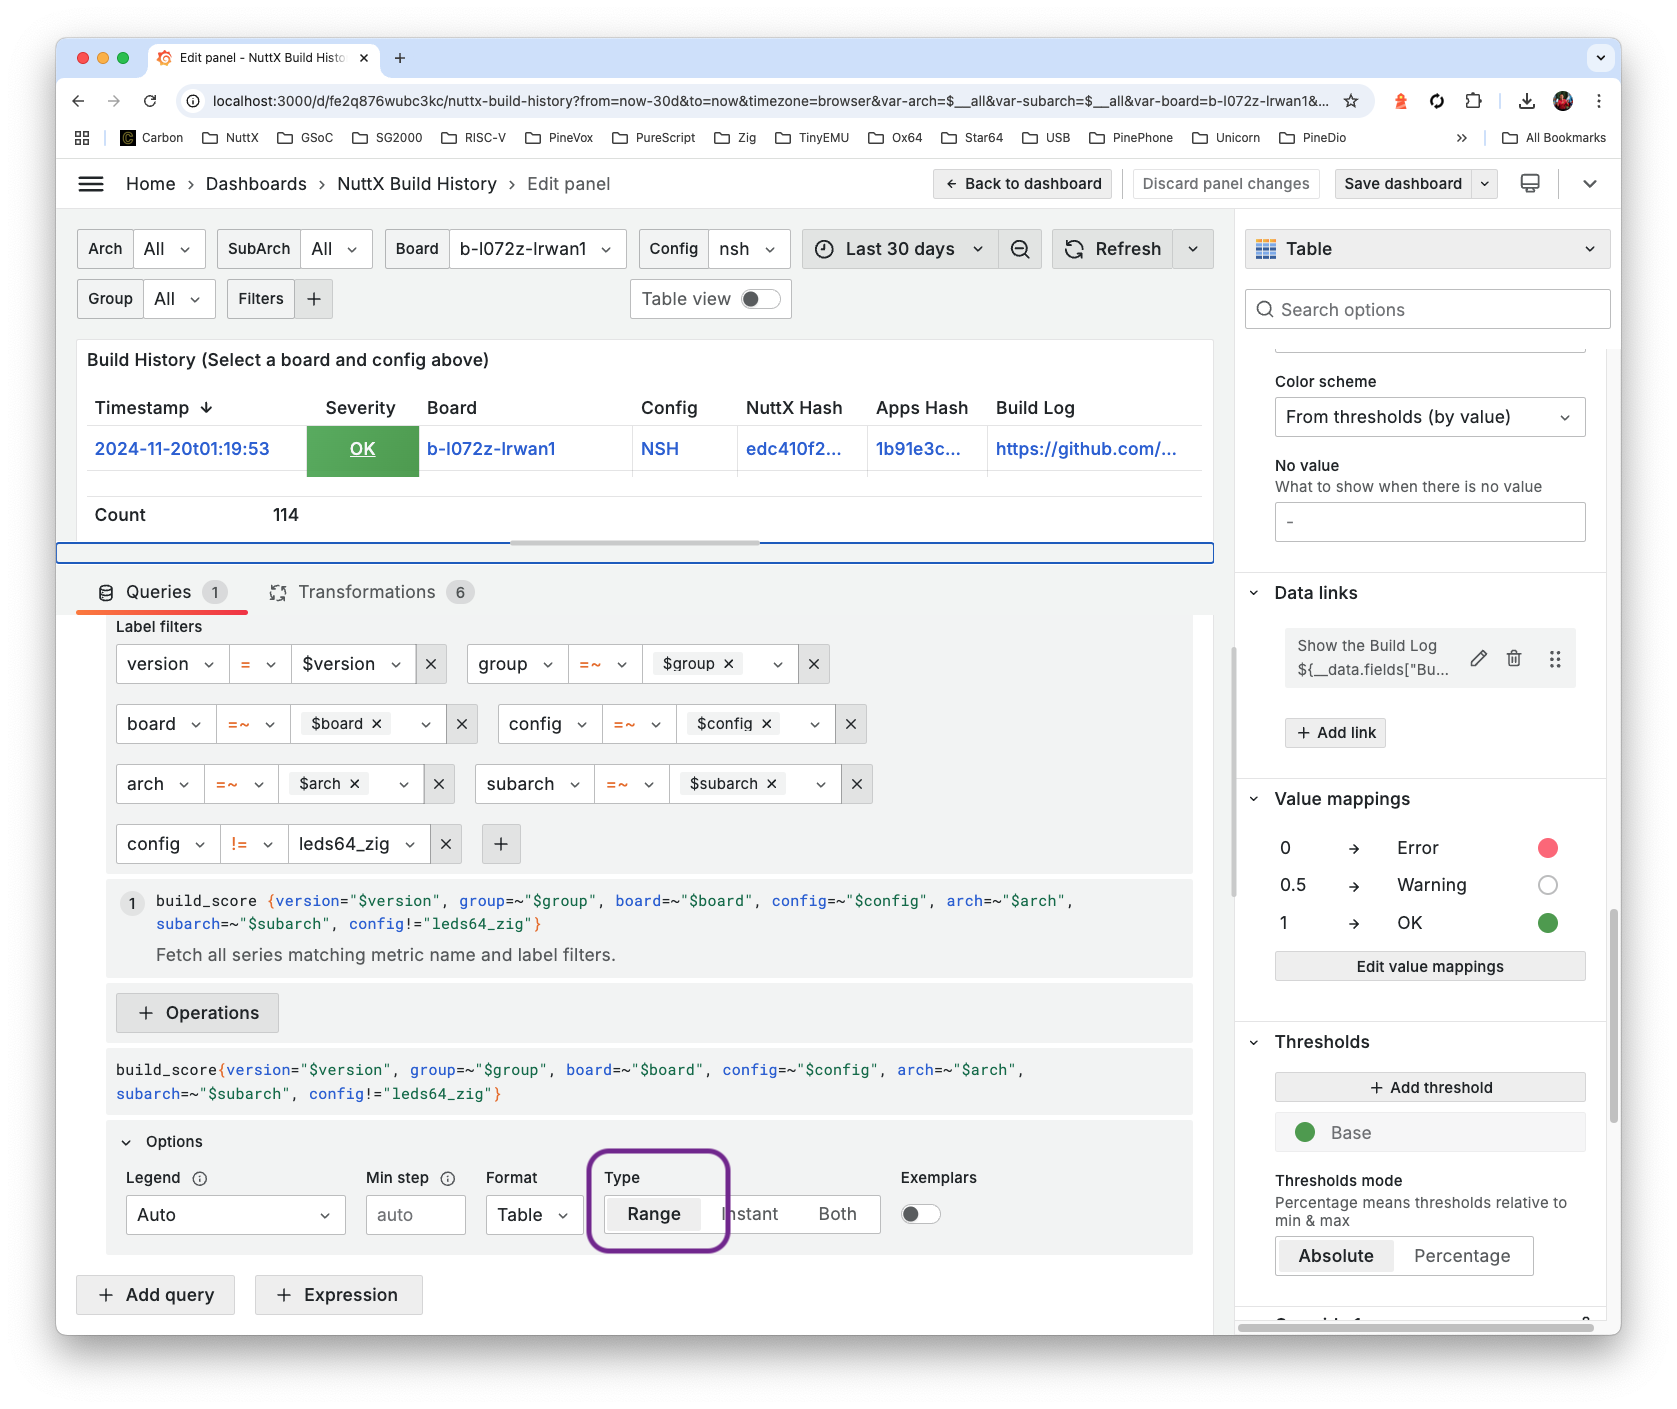
-
Under Queries: Set Options > Type to Range
-
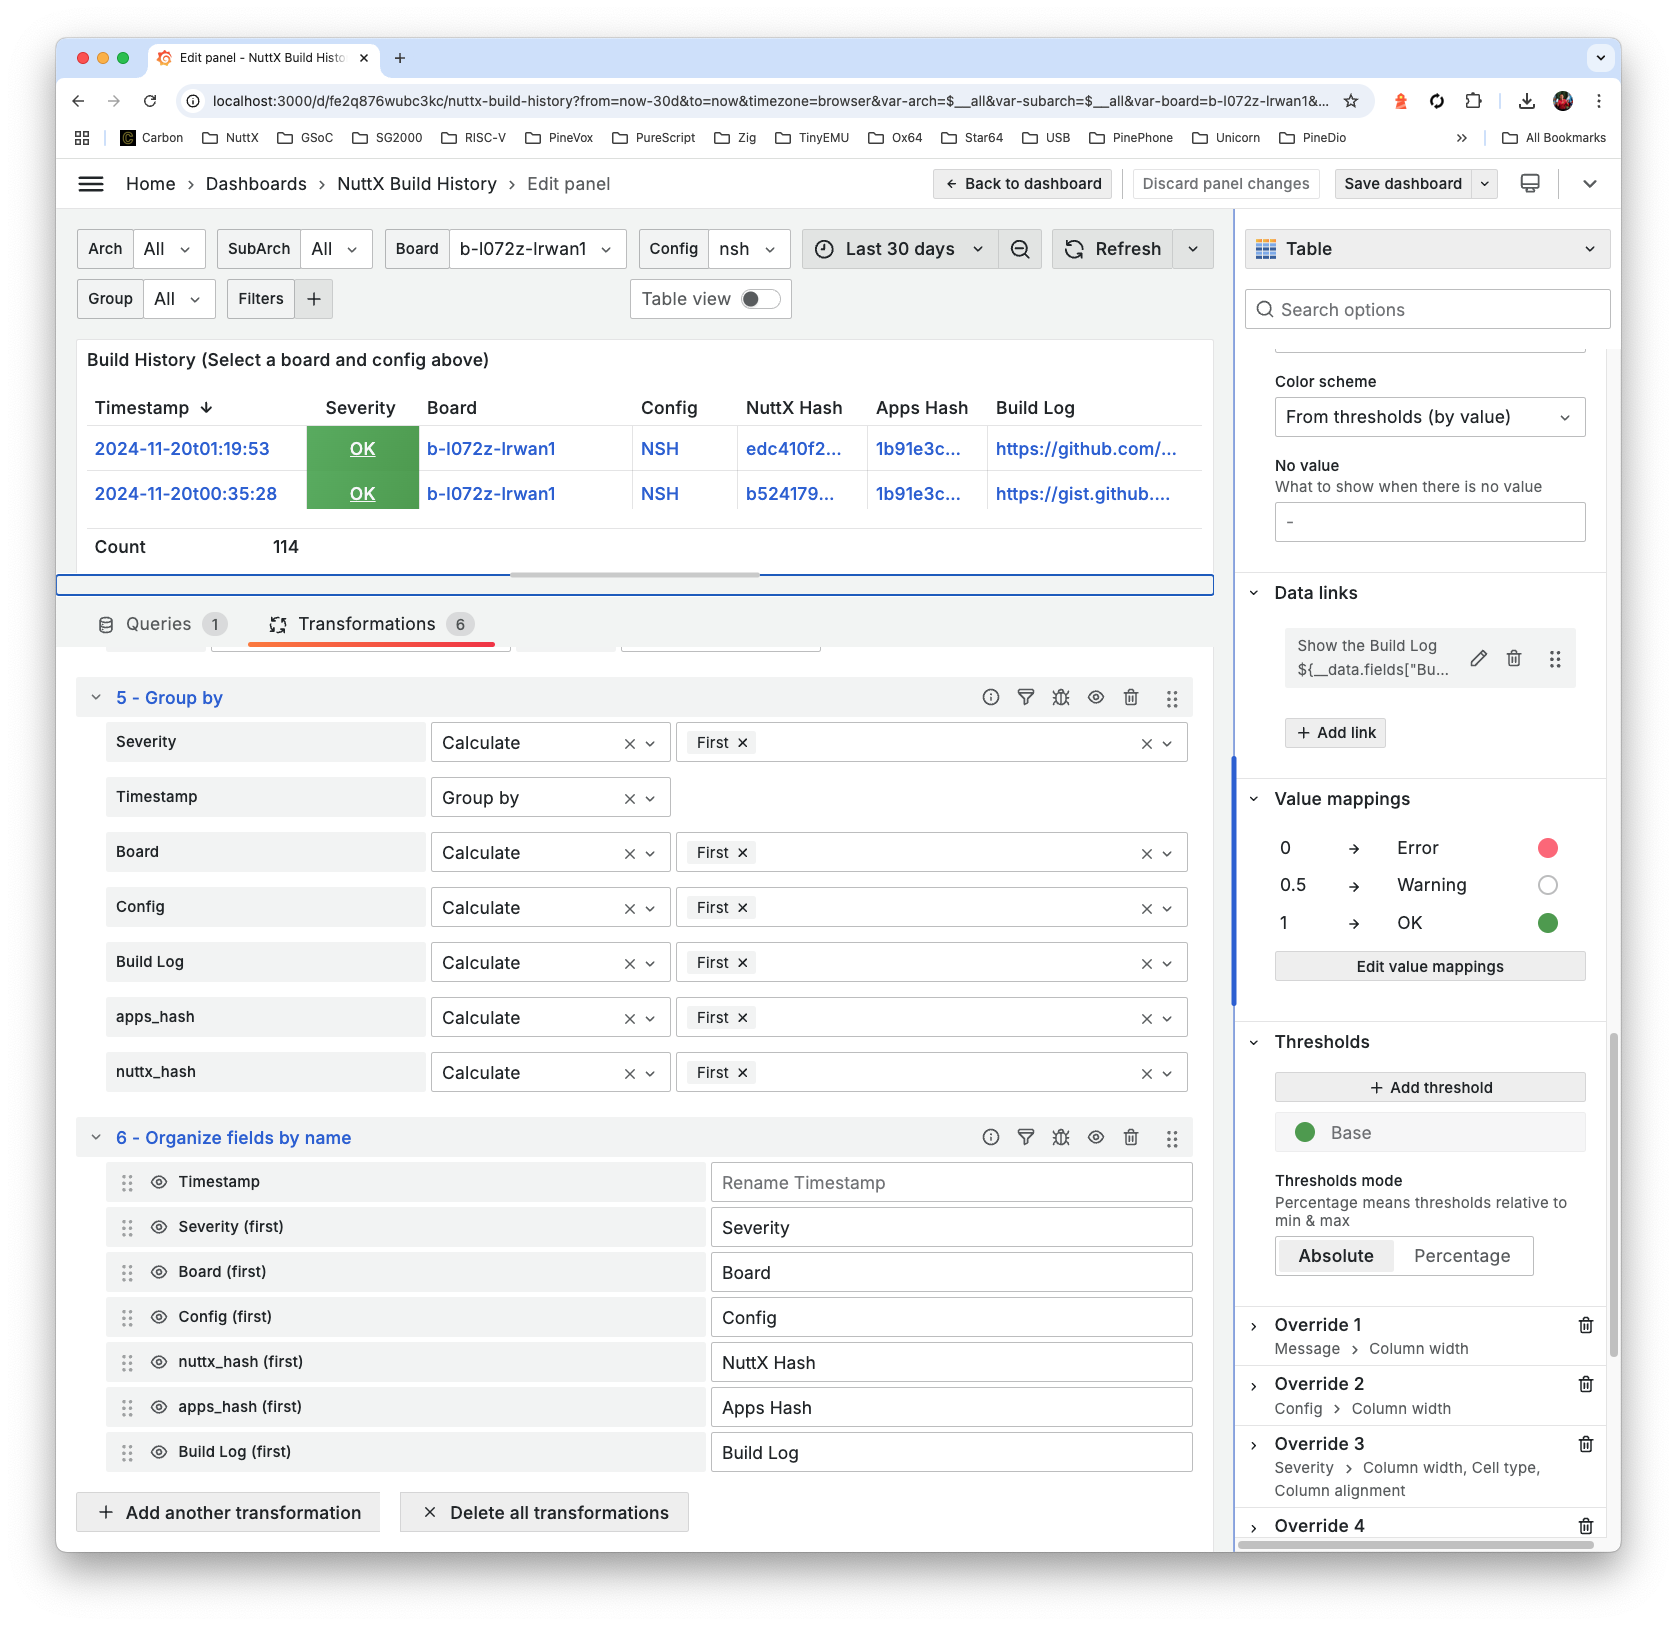
Under Transformations: Set Group By to First Severity, First Board, First Config, First Build Log, First Apps Hash, First NuttX Hash
In Organise Fields By Name: Rename and Reorder the fields as shown below
Set the Value Mappings below
-
Here are the Panel and Dashboard JSON…
Is Grafana really safe for web hosting?
Use this (safer) Grafana Configuration: grafana.ini
-
Modified Entries are tagged by “TODO”
-
For Ubuntu: Copy to /etc/grafana/grafana.ini
-
For macOS: Copy to /opt/homebrew/etc/grafana/grafana.ini
Watch out for the pesky WordPress Malware Bots! This might help: show-log.sh
## Show Logs from Grafana
log_file=/var/log/grafana/grafana.log ## For Ubuntu
log_file=/opt/homebrew/var/log/grafana/grafana.log ## For macOS

## Watch for any suspicious activity
for (( ; ; )); do
  clear
  tail -f $log_file \
    | grep --line-buffered 'logger=context ' \
    | grep --line-buffered -v ' path=/api/frontend-metrics ' \
    | grep --line-buffered -v ' path=/api/live/ws ' \
    | grep --line-buffered -v ' path=/api/plugins/grafana-lokiexplore-app/settings ' \
    | grep --line-buffered -v ' path=/api/user/auth-tokens/rotate ' \
    | grep --line-buffered -v ' path=/favicon.ico ' \
    | grep --line-buffered -v ' remote_addr=\[::1\] ' \
    | cut -d ' ' -f 9-15 \
    &

  ## Restart the log display every 12 hours, due to Log Rotation
  sleep $(( 12 * 60 * 60 ))
  kill %1
done