The momentum of the solar energy transition
Towards a new baseline scenario
Following the recent progress of renewables, fossil fuel-dominated projection baselines are not realistic anymore. Here, we focus on the co-evolving dynamics of diffusion and innovation to project the mid to long-term diffusion trajectory of 24 power technologies. We use the historical data-driven E3ME-FTT integrated energy-economy model, in which a system dynamics simulation method, combined with choice modelling (see Methods), tracks the positive feedbacks that emerge between cost reductions and diffusion, something not usually represented in models that have fixed yearly learning5. We use IEA data for historical generation, CAPEX and OPEX, BNEF for capacity factors, construction and lifetimes until 2020, IRENA for historical renewables capacity data between 2019 and 2021.
Technological trajectories typically have inertia in their diffusion that depend on their lifecycle turnover, with half-lives ranging between 10 and 15 years for short-lived units (cars), 25–40 years for fossil fuel plants, and 50–100 years for long-lived infrastructure, such as nuclear plants and hydro dams36. These long lifetimes prevent technological trajectories from changing direction abruptly. This autocorrelation time in the direction of evolution (or degree of inertia) implies that energy system technological forecasting constrained by observed diffusion and cost trajectories, as done here, can be reliable within at least 15-20 years, subject to an increasing error that cumulates over the simulation time span.
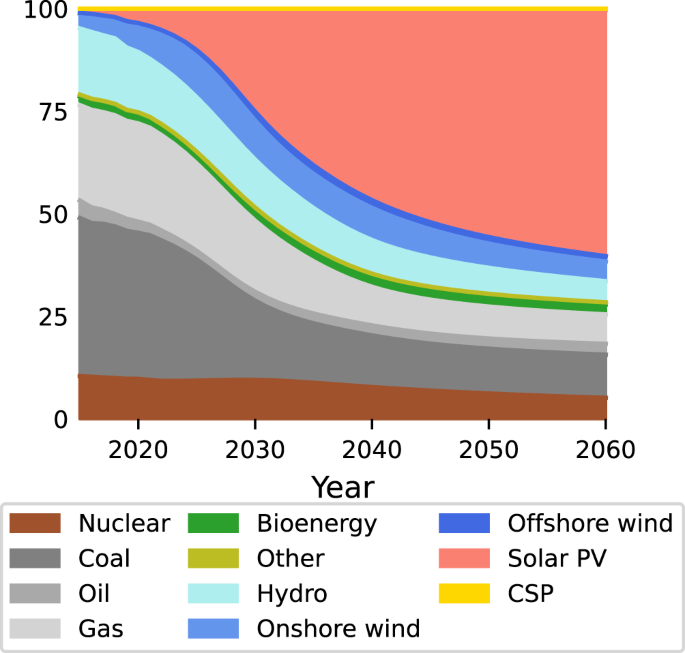
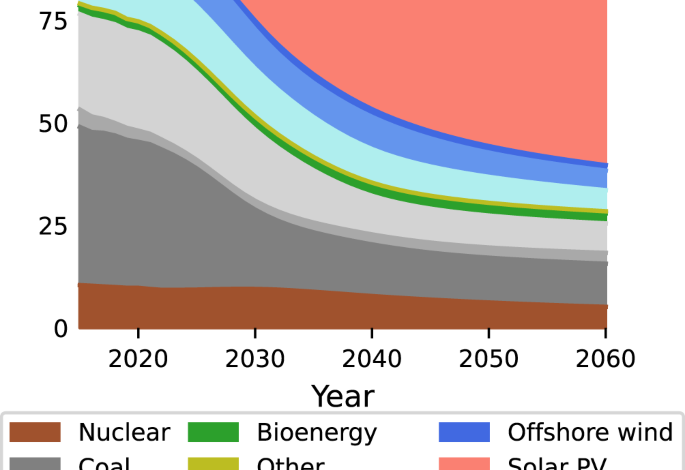
Figure 1 shows the global share of electricity production of 11 key technologies (Supplementary Figure 1 for a regional breakdown). The current mix is highly varied. By mid-century, according to E3ME-FTT, solar PV will have come to dominate the mix, even without any additional policies supporting renewables. This is due to solar costs declining far below the costs of all alternatives, while its parent industrial supply capacity increases rapidly. Its scale expands, because of its current rapid and exponential diffusion trajectory and comparatively high learning rate. Even the market shares of onshore and offshore wind power in the global electricity mix start declining around 2030, outpaced by solar. This is due to a lower learning rate of wind compared to solar and a growing cost gap in the model. However, onshore continues growing in absolute terms until 2040, and offshore to the end of the simulation. Concentrated solar power grows over the entire period, but without targeted policy its overall share in the power mix remains small, despite its advantage as a dispatchable source of electricity.
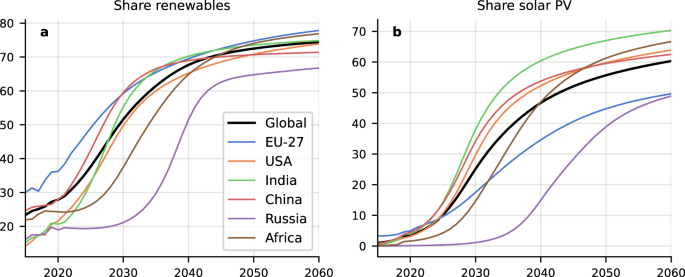
The trend towards renewables dominance (Fig. 2a) and notably solar PV (Fig. 2b) appears imminent in China, and lags in Africa and Russia. Africa lags despite a very high technical potential and low seasonality. The slow uptake can mostly be attributed to nonpecuniary aspects (grid flexibility, trust in new technologies), which requires prices to fall further below alternatives before there is significant uptake. This occurs after uptake by other countries drives down prices further.
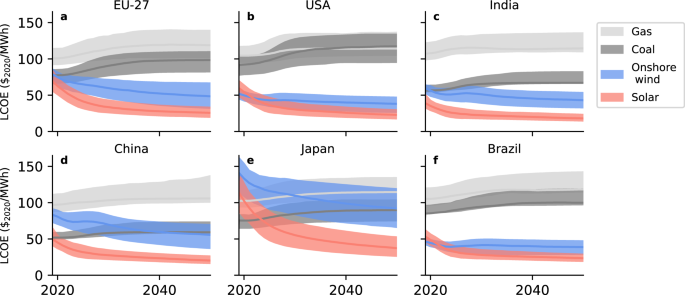
The levelised cost of electricity (LCOEssc, which includes system storage costs, see Methods) is shown in Fig. 3. We tentatively assign additional system costs for storage to be borne by renewable energy producers. Even though storage needs increase substantially over time, LCOE for solar energy decreases overall. This is because the learning rate for short-term storage is very high, and the learning rate for long-duration storage (we assume hydrogen is used for seasonal storage) is expected to be relatively high too8. Of the major countries shown, solar PV is initially more expensive than coal only in Japan, where cost-parity is reached around 2025.
a EU-27 (b) United States (c) India (d) China (e) Japan and (f) Brazil. Shaded areas are the 10–90% confidence interval. Solar PV + system storage is already among the cheapest forms of electricity. In some regions, wind and solar remain competitive, whereas solar becomes much cheaper in others. Without carbon taxation, coal is typically cheaper than gas.
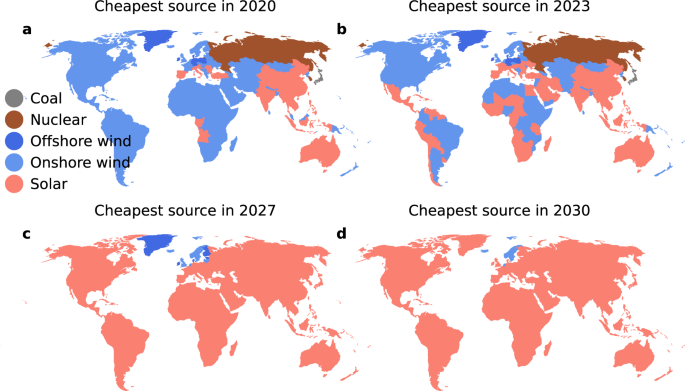
In 2020, wind energy has the lowest LCOE in a majority the 70 regions defined in the E3ME-FTT models (Fig. 4). Where this is not the case, solar PV, nuclear or coal dominate. By 2030, this has flipped, in favour in solar power across most of the world (see Supplementary Figs. 2 and 3 for worst/best case maps). We assume a uniform declining cost per kW of PV panels worldwide, with differing solar irradiation for each region. This assumption is based on empirical findings37. Due to this international spillover effect, most regions of the world are likely going to gain access to low-cost solar energy. As such, a region may reach cost parity between solar and the cheapest alternative through the influence of other countries on the scale of production and costs, even if cumulative investments in that region are modest. This implies that developing countries could become realistic markets for solar energy even when the capacity of their governments to implement climate policies remains limited.
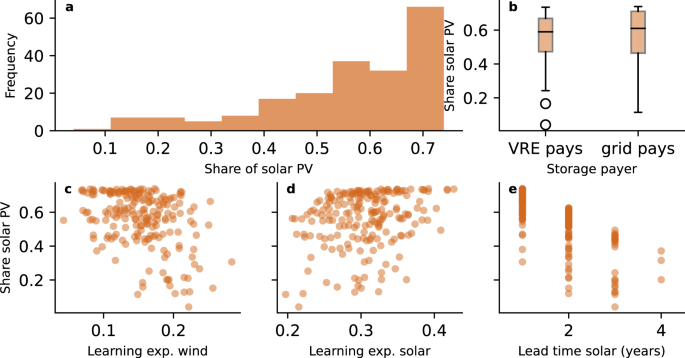
Figure 5 shows the robustness of the result to a set of model assumptions (see Methods). The two most important sources of uncertainty are potential delays in making necessary grid adjustments and the learning rate for wind power. If installing solar power plants takes twice as long due to delays with grid expansions, the median share of solar in 2050 drops by 16 percentage points. Notably, with solar prices far below alternatives, higher learning rates have a small effect on diffusion. Overall, in 72% of the simulations done for robustness testing, solar makes up more than 50% of power generation in 2050. This suggests that solar dominance is not only possible but also likely.
a The overall histogram of the 2050 shares of solar PV. b The shares solar PV depending on who pays for storage costs (variable renewable energy (VRE) sources, or the grid operator). Box plot elements: Centre line: median, box limit: upper and lower quartiles, whiskers: 1.5x interquartile range, points: outliers c, Shares of solar PV depending on the learning rate of onshore and offshore wind energy, d, depending on the learning rate of solar PV and e, depending on the lead time for solar projects.
These projections and sensitivities give us some confidence to suggest that realistic energy model baselines should, from now on, include substantially larger shares of solar energy than what is commonly assumed, as they make coal and gas-dominated baseline scenarios largely unrealistic. The main scenario framework assessed in the IPCC reports, the socialeconomic pathways (SSPs), include scenarios with increasing reliance on coal to the energy mix38. This work notably indicates these scenarios are highly improbable.
The above projections appear robust with respect to cost and technical factors included in the model. However, systemic problems not modelled could, nevertheless, develop into barriers hindering achieving climate targets. This suggests that further climate policy action should focus on addressing these barriers.
Overcoming barriers
We highlight four barriers that go beyond considerations of levelized costs and a) may significantly slow down the solar tipping point if unaddressed b) are global and c) are not fully implemented into integrated assessment models. The four identified encompass the technological, policy, market and economic, regulatory, political and social barriers identified by the literature39 as the most relevant for solar PV deployment in the next three decades.
As a first barrier, we consider grid resilience. In many published energy scenarios with higher shares of solar and wind power, “dark doldrums”, periods of simultaneously low wind speeds and solar irradiation, form the predominant vulnerability40. From geophysical constraints, it is possible to compute an optimal mix of wind and solar power, which maximises the match between supply and demand. The typical optimal share of solar when 12 h of battery storage is available lies between 10–70%, depending on geography. Where less storage is available, the optimal mix shifts towards more wind power11. When either of the two main technologies is (near)-absent, the grid becomes more vulnerable to weather fluctuations. As such, solar-dominated grids may not be desirable. Importantly, no mechanism guarantees that optimal grids are achieved if left to market forces, especially in contexts of diverging technology costs, and solar dominance could become self-limiting. While E3ME-FTT models grid constraints of a typical year, weather extremes are not considered.
The self-limiting effect of solar PV diffusion due to intermittency can be overcome with a policy mix supporting wind power and other zero-carbon energy sources, as well as improved storage, grid connections and demand-response. Notably, new power market rules can be designed to incentivise investment in generators that complement solar production on a daily to seasonal scale, according to the savings in storage that they generate. Specifically, our model suggests that the allocation of storage costs to the grid and charged directly to consumers incentivises more renewables diffusion than requiring renewables to carry the full burden of storage needs (see Fig. 5), leading to lower overall system costs41.
Secondly, the availability of finance may act as a barrier. Solar growth trajectories will inevitably depend on the availability of finance. Low-carbon finance is presently highly concentrated in high-income countries42. Even international North-South flows largely favour middle-income countries, leaving lower income countries – particularly those in Africa – deficient in solar finance despite the enormous investment potential42.
This unequal distribution of finance reflects different investment risk considerations across countries. Differences in local financial environments, such as macroeconomic conditions, business confidence, policy uncertainty and regulatory frameworks impact risk perceptions and the willingness to invest by domestic and international actors13. Equity investors and financial lenders apply high-risk premiums in perceived risky regional contexts, thus increasing the cost of capital for renewable projects13,43.
Developing countries are particularly financially and fiscally constrained. Domestically they are characterised by under-developed capital markets and lack capital stock44; whereas international finance is restricted due to high sovereign risks and local currency risks on account of volatile economic fundamentals (as projects are funded with foreign currency while returns are generated in local currencies45,46). This leads to a chronic lack of available finance to support investments in solar energy.
Energy sector deficiencies further exacerbate the negative investment outlook for solar projects. Weak contract enforcement, changing energy regulations, and underdeveloped electricity markets affect project returns and investment viability. Developing countries may also face high import costs due to shortages in foreign currency reserves needed to support an expanding solar sector.
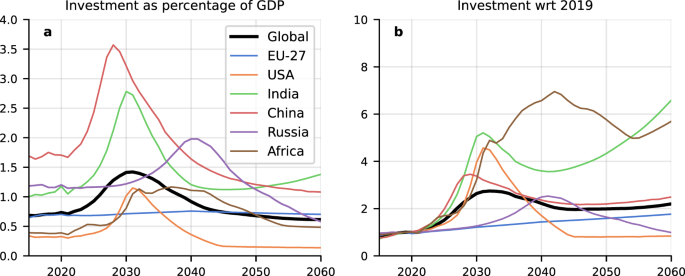
Consequently, a key challenge for global solar deployment lies in the mismatch between high investment needs (see Fig. 6 for modelled investment needs) and finance flows mobilised in developing countries44. Latest estimates suggest that climate financial flows would need to increase by a factor 4 to 8 in most vulnerable countries (IPCC 2022)47. Strategies to address this finance gap should include mechanisms to absorb currency and investment risk as a bridge to unlock international capital flows while creating domestic financial capacity over time.
a shows power sector investments as a percentage of GDP. The strong peak around 2030 for China and India is explained by a saturation in addition of additional solar capacity, in combination with a growing GDP and declining solar costs. b shows power sector investment with respect to 2019 values. Investment is forecast to see a fast growth worldwide relative to historical trends. Various regions in the Global South, in particular India and Africa, will see an even steeper rise in investment in generating capacity by mid-century, due to projected rapid economic growth.
As a third barrier, we discuss supply chains. A solar-dominated future is likely to be metal and mineral-intensive48. Future demand for “critical minerals” will increase on two fronts: electrification and batteries require large-scale raw materials – such as lithium and copper; niche materials, including tellurium, are instrumental for solar panels49. As countries accelerate their decarbonisation efforts, renewable technologies are projected to make up 40% of total mineral demand for copper and rare earth elements, between 60 and 70% for nickel and cobalt, and almost 90% for lithium by 204014.
The notion of criticality comes in three forms: physical, economic, and geopolitical. Firstly, there are risk associated with low reserves. Secondly, minerals supply typically reacts slowly to short-term changes in demand in, due to the long times required to establish mineral supply chains. This could lead to price rallies. The construction of new mining facilities (from exploration to mine operations) requires on average 16.5 years14 and may be stalled due to concerns about socio-environmental impacts50.
The geopolitical supply reliability of critical minerals is also weak, since mineral production displays higher geographical concentration, compared to fossil fuels production. China and The Democratic Republic of Congo, for example, own 60% and 70% of current global production of rare earth minerals and cobalt respectively51. Domestic shocks, including growing climate risks and political instability, could hamper the extraction and production and generate price shocks that along the value chain, impacting solar technology costs. Electricity networks could suffer similar impacts for nickel and aluminium.
Risk associated with low reserves can be mitigated with (research into) substitutions52. Recycling and circular economy processes can further reduce extraction rates, but re-used materials are unlikely to meet future demand as it outgrows existing stocks53.
Lastly, resistance from declining industries may impact the transition. The pace of the transition depends not only on (economic) decisions by entrepreneurs, but also on how desirable policy makers consider it. Solar energy aligns with many policy objectives (clean air, poverty alleviation, energy security54). It also has disadvantages for some of the players involved, as it leads to rapid economic and industrial change.
Solar and wind power have a low energy density compared to alternatives. In most countries, they can provide enough energy to meet demand. However, land for renewables may be scarce close to population centres in some parts of the world55,56. Political tension on the use of land and water (for floating photovoltaics57) may increase as solar shares rise.
A rapid solar transition may also put at risk the livelihood of up to 13 million people worldwide working in fossil fuel industries and dependent industries. These people are frequently concentrated in communities close to mines extraction and industrial sites, where the closure of these activities can have severe repercussion on the well-being of communities decades on58. Policy makers could have substantial incentives to slow down the transition to limit these direct impacts. Similarly, many countries currently provide fossil fuel subsidies to increase the purchasing power of low-income households, difficult to phase out and which reinforce opposition to change. New coalitions of actors who benefit from the transition (home and landowners, people with jobs in clean energy), may counterbalance some of the resistance from incumbents15, but do not resolve equity issues. Regional economic and industrial development policy can resolve inequity, and can mitigate risks posed by resistance from declining industries59.
